
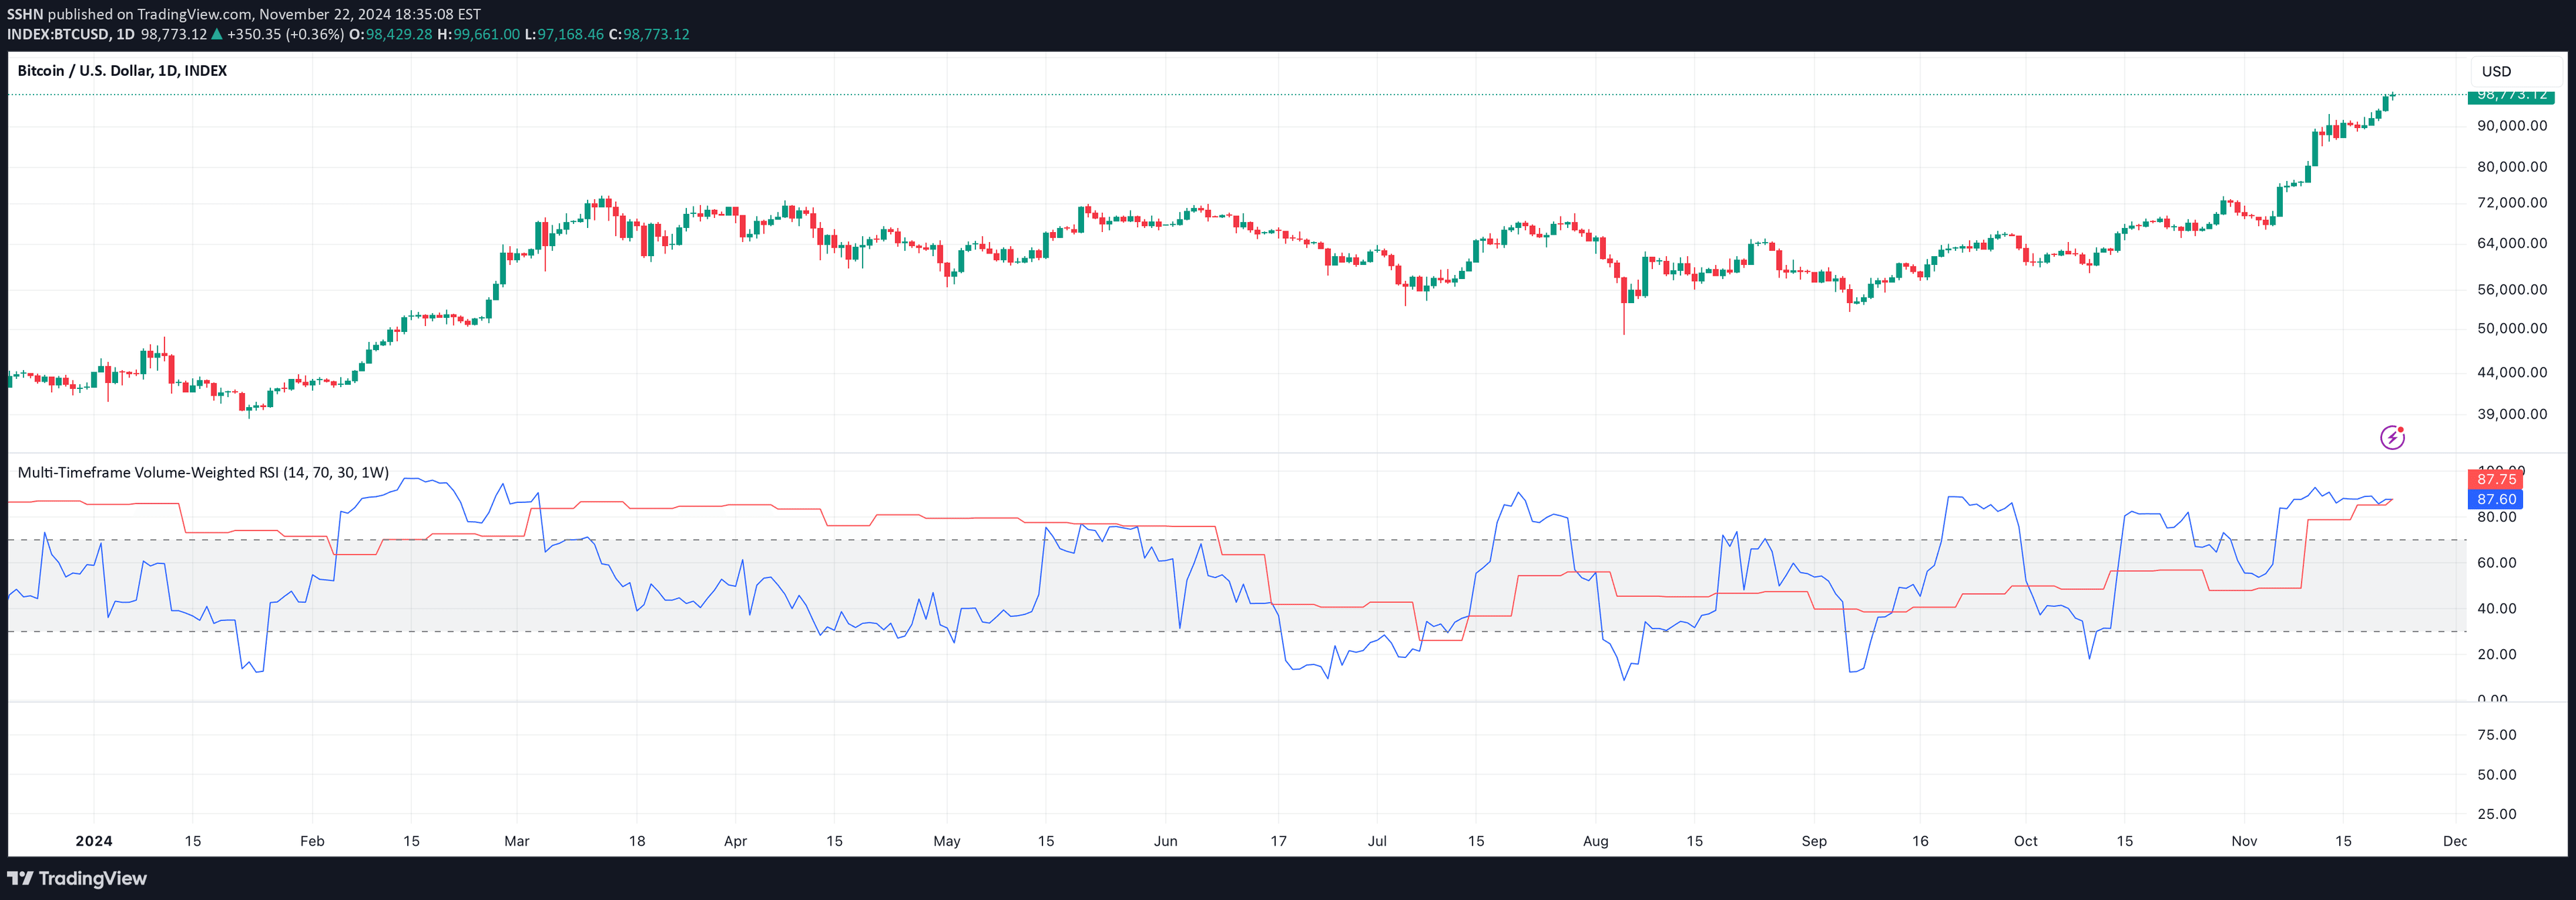
A volume-weighted RSI that incorporates trading volume into momentum analysis, providing more reliable signals by weighing price changes against market participation intensity.
Explore complementary indicator rolesHow it works
The volume-weighted RSI modifies the traditional Relative Strength Index by incorporating trading volume as a key multiplier in momentum calculations. Instead of simply measuring price movement, it assigns greater weight to price changes that occur during periods of high trading activity, effectively filtering out low-volume price fluctuations.
This sophisticated approach calculates the RSI by multiplying standard RSI values with volume data, ensuring that momentum signals are more representative of genuine market sentiment. The resulting indicator produces lines that dynamically reflect both price momentum and trader participation, with different timeframes potentially offering varied perspectives on market dynamics.
Why it may be useful
Traditional RSI indicators often generate signals without considering the underlying market activity, which can lead to misleading momentum assessments. By integrating volume, traders gain a more nuanced understanding of price movements, distinguishing between meaningful market shifts and superficial price changes that lack substantial trader conviction.
The volume-weighted RSI provides enhanced signal reliability by prioritizing high-volume price movements, reducing the likelihood of false breakouts and improving overall trade decision-making. This approach offers traders a more comprehensive view of market momentum, allowing for more informed and potentially more profitable trading strategies.
When to explore it
The volume-weighted RSI proves most effective in markets with consistent and transparent volume data, particularly in liquid asset classes like stocks, futures, and heavily traded cryptocurrencies. Traders can leverage this indicator during trending markets to confirm momentum strength and identify potential reversal points with greater confidence.
It is particularly valuable when analyzing assets experiencing significant price movements, helping traders distinguish between genuine trend developments and temporary price fluctuations. The indicator's multi-timeframe capabilities make it adaptable across different trading styles, from short-term scalping to longer-term swing trading strategies.
Keep exploring
What we’ve verified
Access, alerts and repainting behaviour have not been independently verified for this indicator. Check the creator’s current publication and settings.
General descriptions and classifications are recovered research. Verified details above identify the specific checks we have completed. Check the creator’s current publication for later changes.


