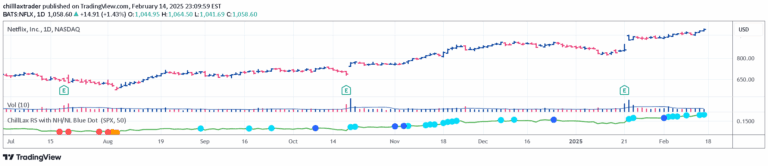
A technical analysis tool that compares a stock's performance against a benchmark index, revealing relative strength and potential market leadership through comprehensive RS calculation and visualization.
Explore complementary indicator rolesHow it works
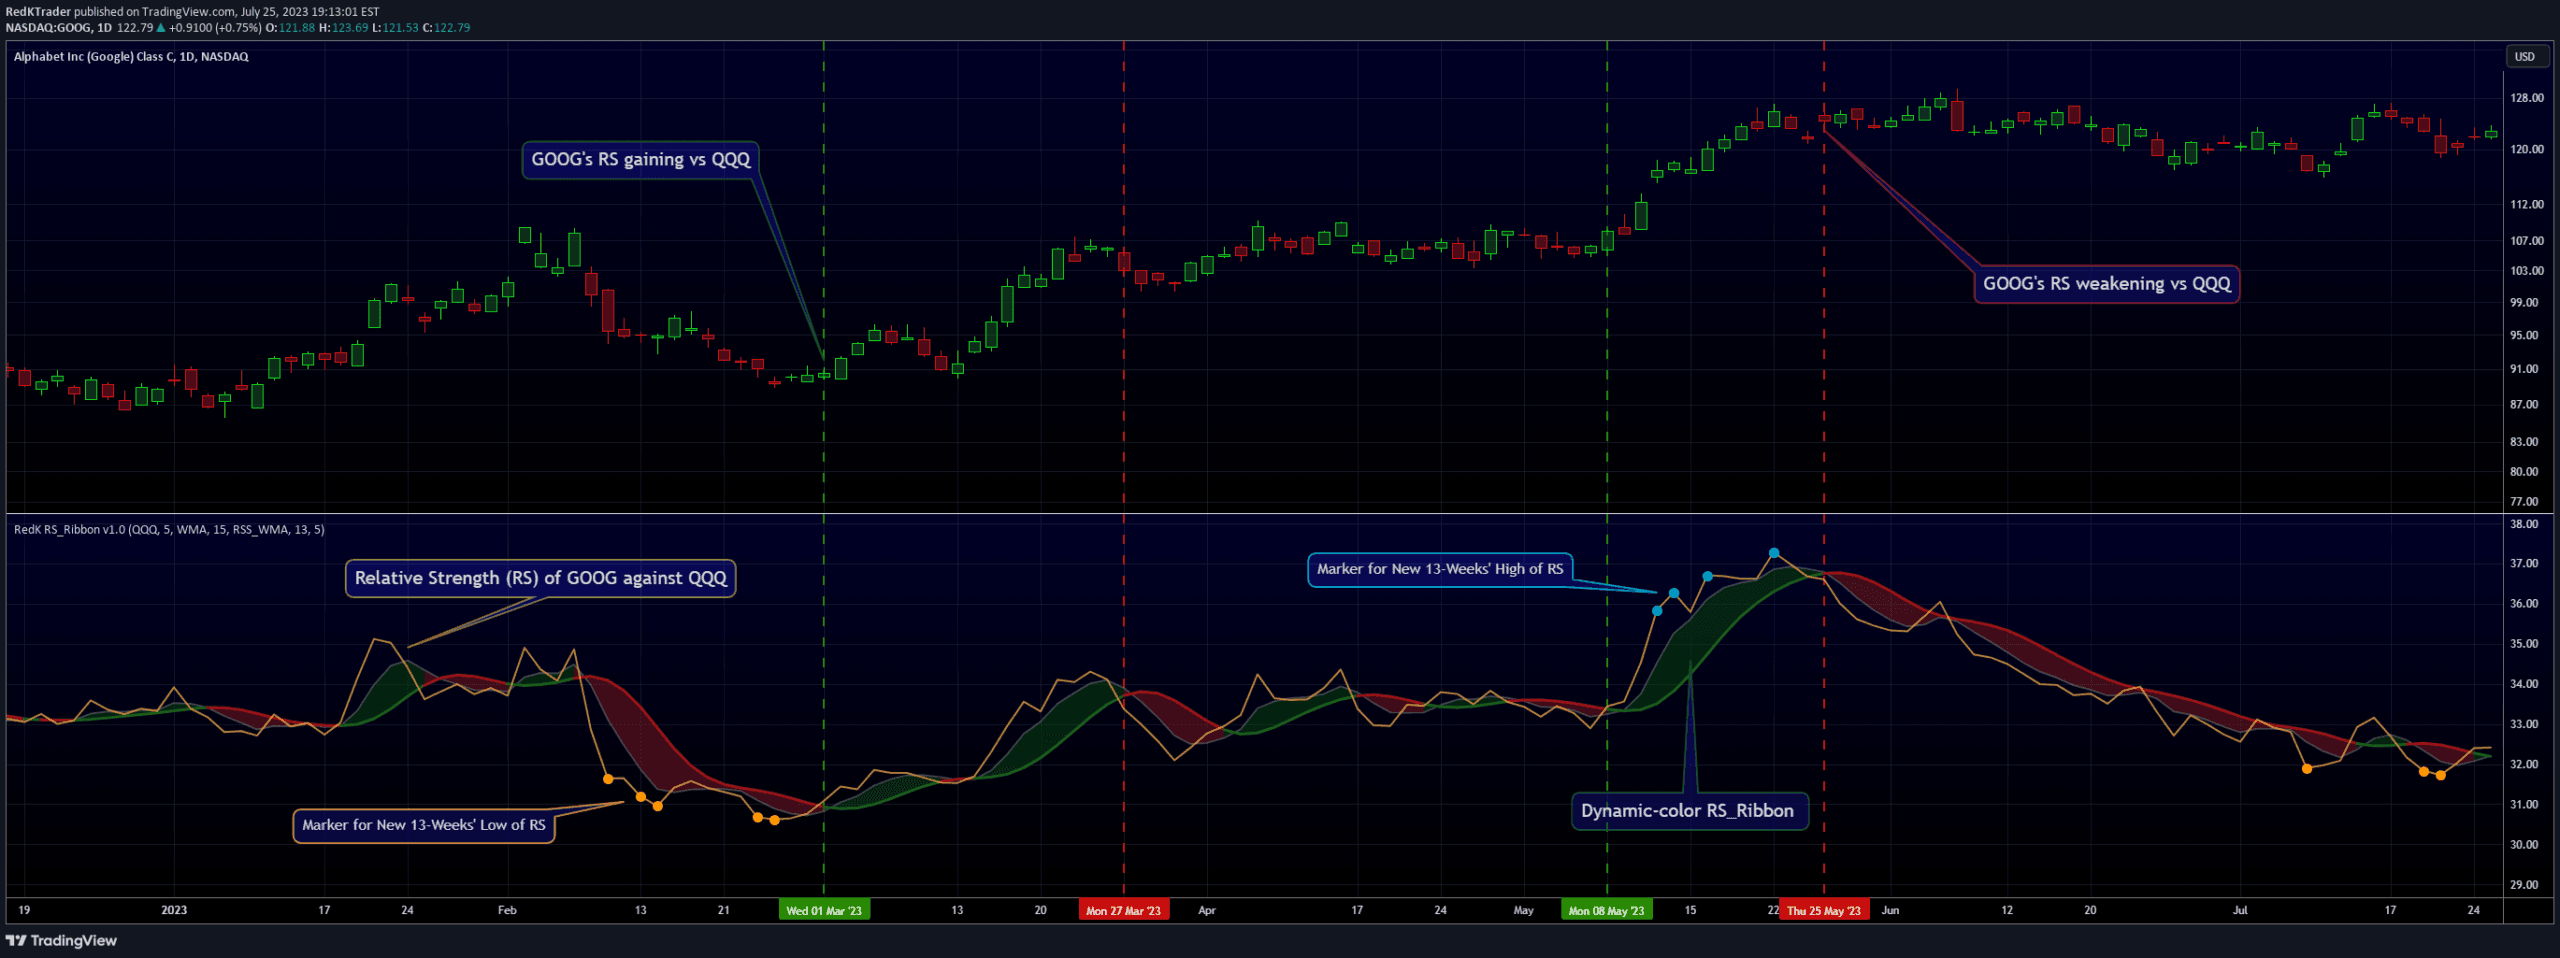
The RedK Relative Strength Ribbon calculates relative strength by dividing the closing price of the current chart symbol by the closing price of a base symbol (typically SPY) and multiplying by 100. This generates an RS line that tracks the performance of one asset against another, creating a comparative metric that helps traders understand market dynamics.
The indicator enhances the basic RS calculation by adding moving averages to create an RS ribbon, which changes color to indicate trend direction. It also includes features like identifying new weekly high/low RS values and the ability to generate RS charts with regular or Heikin Ashi candles for comprehensive market analysis.
Why it may be useful
Relative Strength analysis provides traders with critical insights into market performance by revealing how a specific security performs compared to a broader market benchmark. This approach helps identify market leaders, particularly during market recovery periods, and offers a nuanced view of an asset's strength beyond its absolute price movement.
By comparing an asset's performance against an index, traders can make more informed investment decisions, understand underlying market trends, and potentially spot emerging opportunities before they become widely recognized. The RS Ribbon transforms this concept into a visual and actionable tool that simplifies complex comparative analysis.
When to explore it
The RedK Relative Strength Ribbon is most effective for growth, swing, and momentum traders seeking to understand an asset's performance relative to a broader market context. It works best when analyzing stocks against representative market indices, helping traders identify potential market leaders and sectors with strong momentum.
Traders should utilize this tool during market transitions, sector rotations, and when evaluating potential investment opportunities. It is particularly useful for identifying stocks that are outperforming or underperforming their sector or the broader market, providing a strategic advantage in portfolio construction and trade selection.
Keep exploring
What we’ve verified
Access, alerts and repainting behaviour have not been independently verified for this indicator. Check the creator’s current publication and settings.
General descriptions and classifications are recovered research. Verified details above identify the specific checks we have completed. Check the creator’s current publication for later changes.