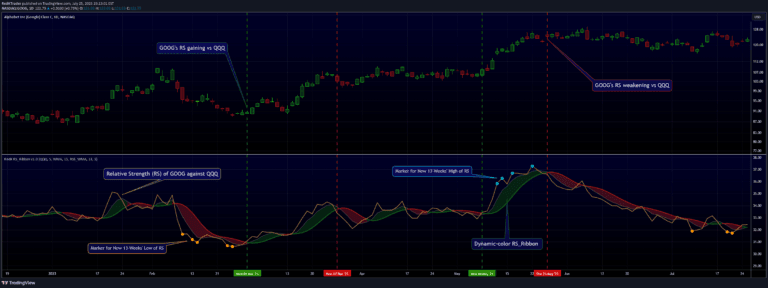
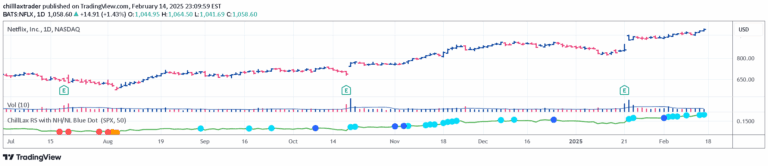
A volatility-adjusted relative strength indicator that compares a stock's performance to a benchmark index by normalizing price movements using Average True Range.
Explore complementary indicator rolesHow it works
The volatility-adjusted relative strength indicator calculates performance by comparing a stock's price movement to a benchmark index while accounting for each instrument's unique volatility. It uses the Average True Range (ATR) to normalize price movements, ensuring a more accurate representation of relative strength or weakness.
By dividing price changes by the stock's ATR, the indicator removes the distortion caused by inherent volatility differences between stocks. This approach allows traders to distinguish between genuine outperformance and mere price fluctuations that mirror market-wide volatility.
Why it may be useful
Traditional relative strength indicators often provide misleading signals by failing to account for individual stock volatility, which can lead to incorrect trading decisions. This volatility-adjusted approach offers a more nuanced and precise view of a stock's true performance relative to a benchmark.
By normalizing price movements, traders can more accurately identify stocks with genuine institutional interest and market-beating potential. This method helps investors filter out noise and focus on stocks that demonstrate real strength or weakness beyond simple price comparisons.
When to explore it
The volatility-adjusted relative strength indicator is most effective in markets with significant price variations and when comparing stocks with different inherent volatility levels. It works best during periods of market uncertainty or when evaluating stocks across various sectors with distinct trading characteristics.
Traders should use this indicator when seeking a more sophisticated approach to identifying market leaders and laggards, particularly during volatile market conditions or when analyzing stocks with complex price dynamics.
Keep exploring
What we’ve verified
Access, alerts and repainting behaviour have not been independently verified for this indicator. Check the creator’s current publication and settings.
General descriptions and classifications are recovered research. Verified details above identify the specific checks we have completed. Check the creator’s current publication for later changes.