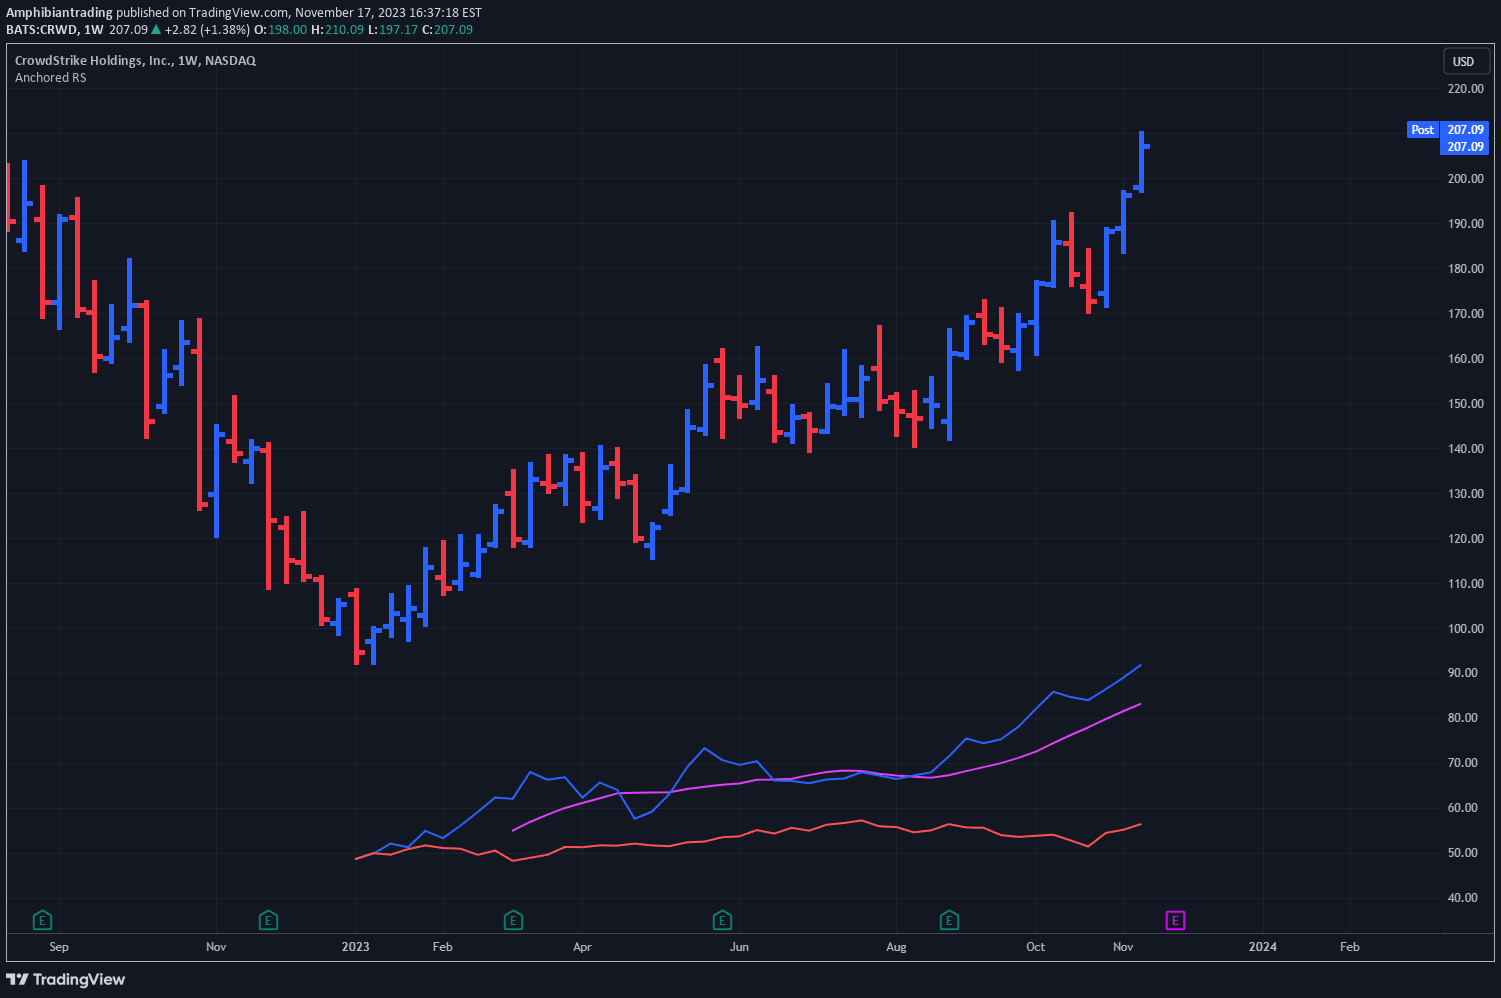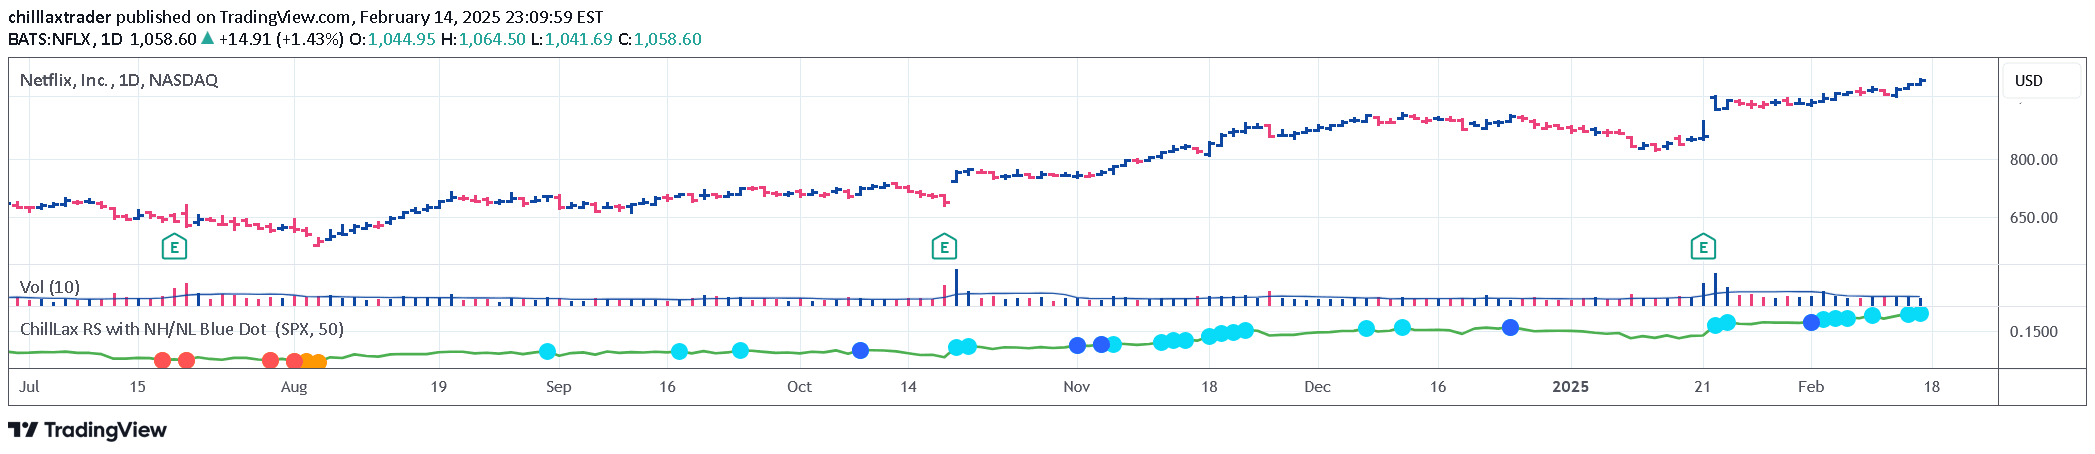
A relative strength indicator that plots dots signaling new highs and lows for an instrument's performance compared to a benchmark index, helping traders identify potential trend changes.
Explore complementary indicator rolesHow it works
The relative strength (RS) line compares an instrument's performance against a benchmark index, typically the S&P 500 (SPX). It calculates the performance difference by tracking price movements and generating visual indicators known as dots.
When the RS line hits a new high within a specified lookback period (default 50 days), a light blue dot appears. If the RS line reaches a new high before the instrument's price, a larger, darker blue dot is displayed. Similarly, for new lows, orange and red dots are used to signal different conditions.
Why it may be useful
This indicator provides traders with a clear visual representation of an instrument's relative performance against a market benchmark. By highlighting potential trend shifts through color-coded dots, it helps traders quickly identify potential entry and exit points.
The signal offers insights into an instrument's strength or weakness compared to the broader market, enabling traders to make more informed decisions about potential momentum changes and comparative performance.
When to explore it
The relative strength indicator is most effective during trending markets where clear momentum differences can be observed between an instrument and its benchmark index. It works best when used in conjunction with other technical analysis tools to confirm potential trend changes.
Traders can utilize this signal across various timeframes, from scalping to swing trading, to identify potential momentum shifts and relative performance opportunities in different market conditions.
Keep exploring
What we’ve verified
Access, alerts and repainting behaviour have not been independently verified for this indicator. Check the creator’s current publication and settings.
General descriptions and classifications are recovered research. Verified details above identify the specific checks we have completed. Check the creator’s current publication for later changes.