YOUR INDICATOR RESEARCH STARTS HERE

Find the right indicator.
Understand what it does.

Explore 11,183 indicators. Filter beyond the obvious.
Discover the tools that fit the way you trade.

THE INDICATOR LIBRARY

Results for “marketsmith”

11,183 tools to explore

15 indicators matching your filters
Save search
LevelsSignal

Quarterly Earnings

by finallynitin

A TradingView script that displays quarterly earnings per share and sales data with year-on-year percentage changes, offering customizable visualization of financial performance metrics.

Main price chart · unverifiedSwing Trading
Explore
3.7Klikes44.7Kviews66comments
Save
MomentumTrend

RS Rating

by Fred6724

The RS Rating evaluates a stock's price performance relative to the market over 52 weeks, helping traders identify stocks that are outperforming and potentially poised for further gains.

Separate pane · unverifiedDay Trading · Swing Trading
Explore
3.4Klikes45.4Kviews223comments
Save
PatternsSignalTrend

MarketSmith Indicator

by Fred6724

A comprehensive TradingView script that mimics MarketSmith charts, offering customizable moving averages, RS Rating, and high/low point detection for technical analysis.

Main price chart · unverifiedDay Trading · Swing Trading
Explore
2.4Klikes31.5Kviews164comments
Save
TrendVolume

MarketSmith Volumes

by Fred6724

A volume indicator designed to mimic MarketSmith graphical volumes, featuring peak volume bars and average volume lines for daily and weekly charts to enhance trading analysis.

Separate pane · unverifiedScalping · Day Trading
Explore
1.2Klikes13.1Kviews40comments
Save
LevelsSignalTrend

Market Smith Indicators

by adaml735

Market Smith's advanced charting tool providing comprehensive stock analysis through moving averages, pivot points, relative strength line, and rating to evaluate stock performance.

Main price chart · unverifiedSwing Trading
Explore
706likes14Kviews14comments
Save
FundamentalSignalTrend

Analytics Trading Dashboard

by Amphibiantrading

A comprehensive trading dashboard that aggregates critical company information, fundamental data, price metrics, and analyst ratings into a single, easy-to-view analytical tool.

Main price chart · unverifiedDay Trading · Swing Trading
Explore
590likes11.1Kviews12comments
Save
Signal

Price Data Label

by Amphibiantrading

An advanced chart indicator providing comprehensive historical bar data through hover functionality, allowing traders to instantly view detailed statistics for each historical price bar.

Main price chart · unverifiedScalping · Day Trading
Explore
406likes9.7Kviews16comments
Save
TrendSignal

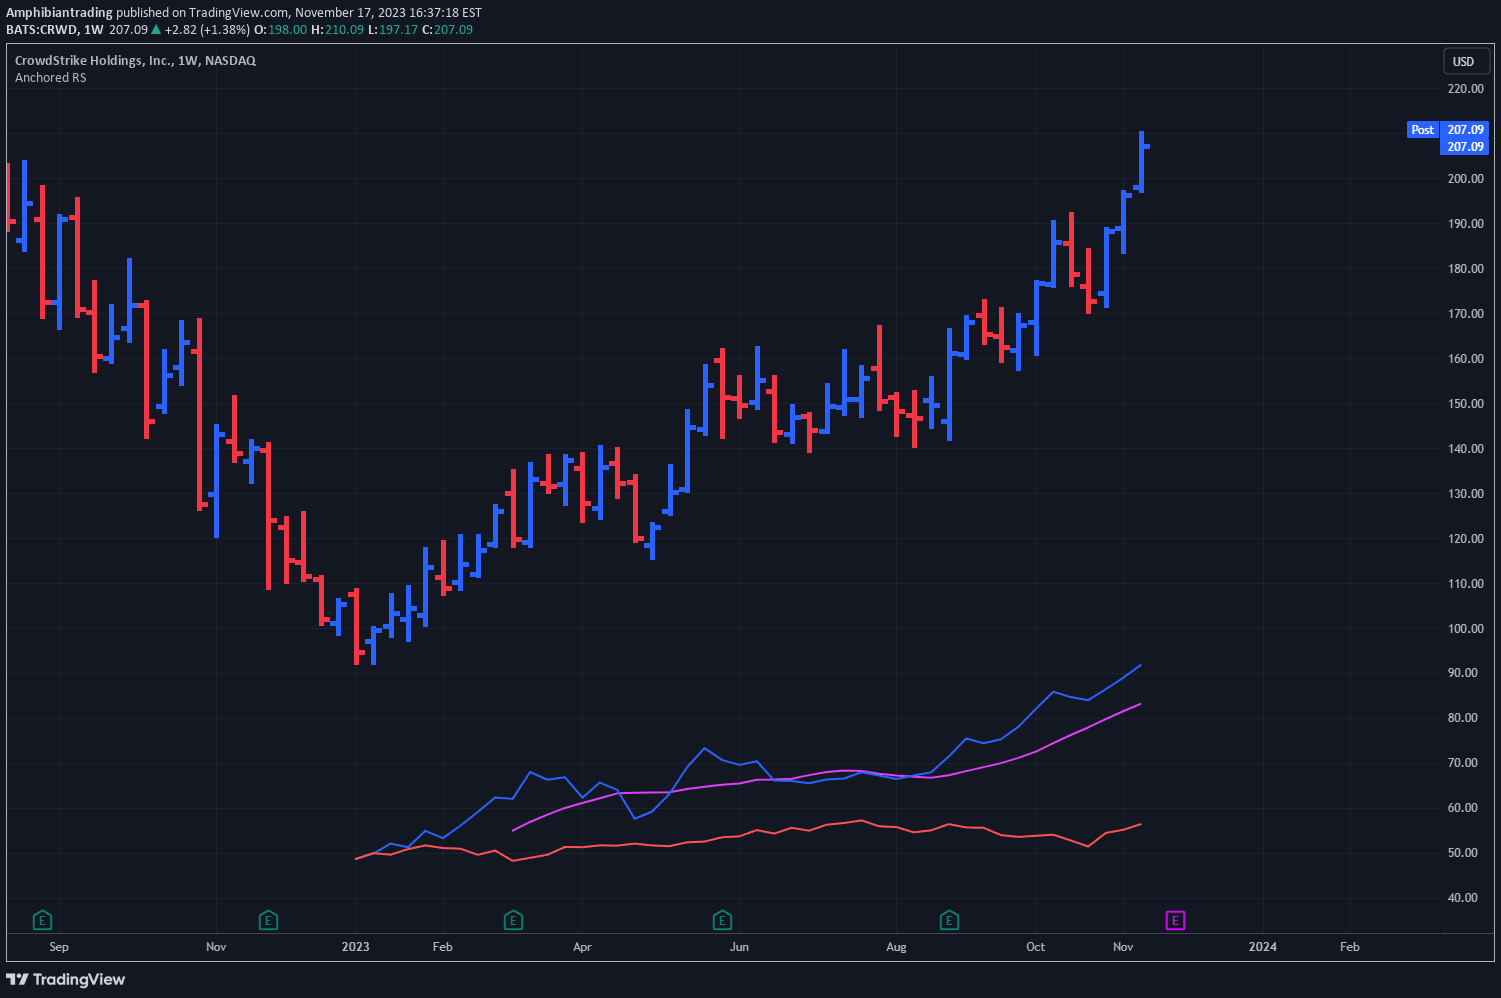
Anchored Relative Strength

by Amphibiantrading

A customizable Relative Strength indicator that compares a stock's performance against a benchmark index from a specific anchor point, enabling targeted performance analysis.

Separate pane · unverifiedDay Trading · Swing Trading
Explore
404likes5.9Kviews10comments
Save
SignalTrend

Equity Curve

by Amphibiantrading

An equity curve indicator that tracks trading account value over time, visualizing performance and helping traders understand their strategy's effectiveness through graphical representation.

Separate pane · unverifiedDay Trading · Swing Trading
Explore
201likes4.3Kviews1comments
Save

Likes, views, and comments are historical TradingView snapshots. They describe attention, not trading performance.

START WITH A QUESTION

A little less searching.
A lot more understanding.

Tell DeepAlpha what you need. Get an explanation, a shortlist,
and a direct path to the indicators behind it.

Ask DeepAlpha