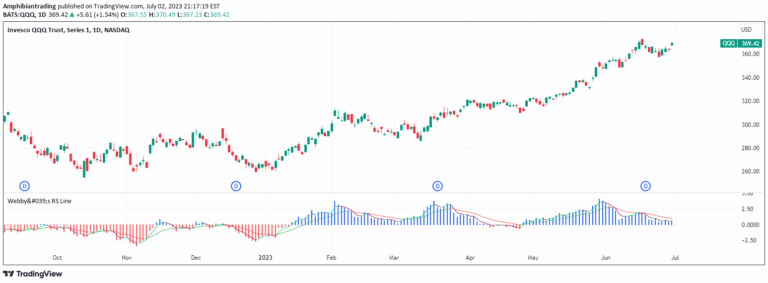
An equity curve indicator that tracks trading account value over time, visualizing performance and helping traders understand their strategy's effectiveness through graphical representation.
Explore complementary indicator rolesHow it works
The equity curve indicator operates by collecting daily account values as a comma-separated list, plotting these values chronologically to create a visual representation of trading performance. Each new equity value is added to the end of the existing list, generating a continuous line that reflects the account's progression.
The indicator also calculates and displays a simple moving average of the equity curve, which helps smooth out short-term fluctuations and reveal underlying performance trends. This moving average serves as a reference point for traders to assess their strategy's consistency and identify potential periods of strength or weakness.
Why it may be useful
The equity curve is crucial because it provides a direct, visual assessment of a trading strategy's effectiveness, allowing traders to objectively evaluate their performance beyond individual trade results. By tracking the account's value over time, traders can quickly identify patterns, recognize the impact of their decisions, and understand their strategy's overall health.
Moreover, the equity curve serves as a psychological tool, helping traders maintain discipline and emotional control by providing a clear, unemotional representation of their trading journey. It encourages traders to adhere to their trading plan during challenging periods and prevents overconfidence during successful streaks.
When to explore it
The equity curve indicator is most effective when used on daily timeframes, providing a comprehensive view of trading performance over extended periods. It is particularly valuable during strategy development, helping traders refine their approach by identifying strengths and weaknesses in their trading methodology.
Traders should utilize this indicator when evaluating long-term performance, comparing different trading strategies, or assessing risk management techniques. It becomes especially useful during periods of market transition or when considering significant changes to an existing trading approach.
Keep exploring
What we’ve verified
Access, alerts and repainting behaviour have not been independently verified for this indicator. Check the creator’s current publication and settings.
General descriptions and classifications are recovered research. Verified details above identify the specific checks we have completed. Check the creator’s current publication for later changes.