Quarterly Earnings
A TradingView script that displays quarterly earnings per share and sales data with year-on-year percentage changes, offering customizable visualization of financial performance metrics.
Explore 11,183 indicators. Filter beyond the obvious.
Discover the tools that fit the way you trade.
11,183 tools to explore
A TradingView script that displays quarterly earnings per share and sales data with year-on-year percentage changes, offering customizable visualization of financial performance metrics.
A trading indicator analyzing stock price movements to calculate a Burst Power score, revealing potential for significant price bursts within Indian market stocks.
A relative strength indicator comparing a stock's performance to an index by measuring the distance from moving averages, providing insights into comparative market behavior.
A dynamic market overview tool that tracks percentage changes across multiple indices or sectors, allowing traders to quickly assess performance and trends across different timeframes.
A comprehensive indicator analyzing daily price range, volatility compression, and trading opportunities through NR7, WR20, TTM Squeeze, and Average Daily Range metrics.
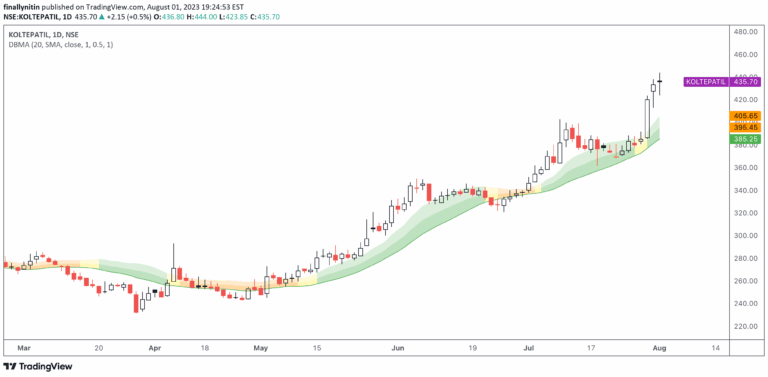
A Dual Bollinger Moving Average (DBMA) indicator that uses moving averages and Bollinger Bands to analyze price compression and potential trading opportunities.
Likes, views, and comments are historical TradingView snapshots. They describe attention, not trading performance.