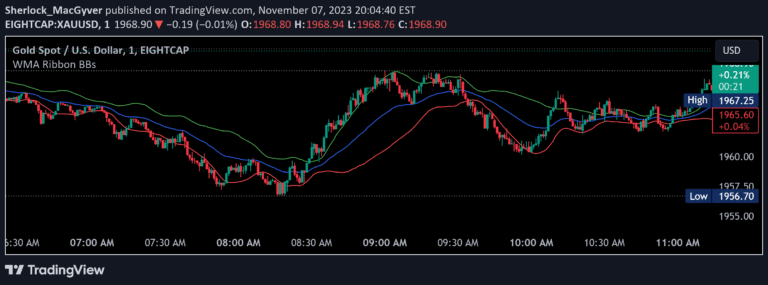
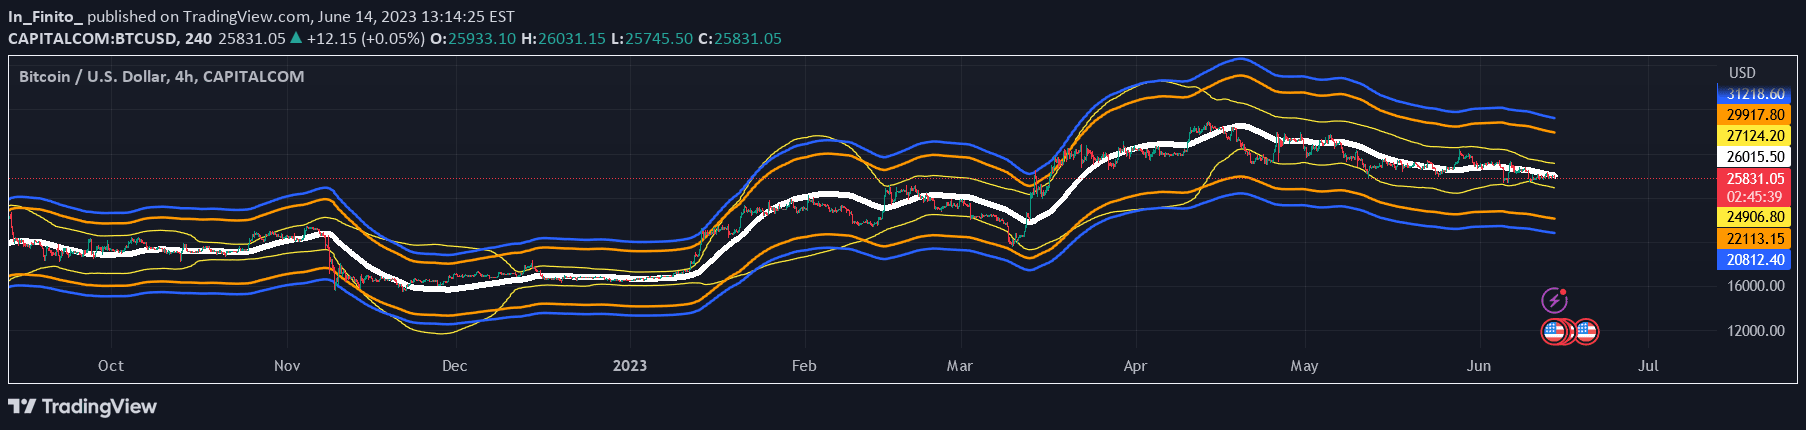
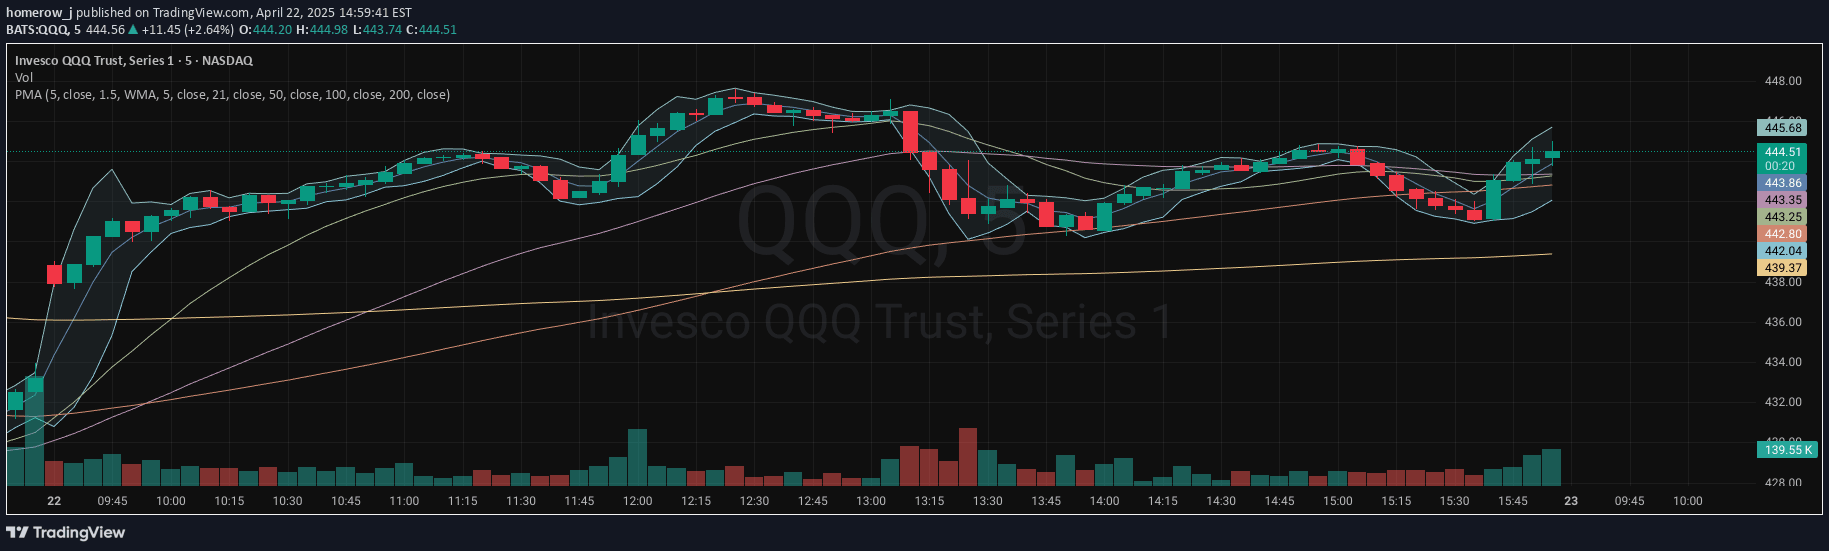
A Dual Bollinger Moving Average (DBMA) indicator that uses moving averages and Bollinger Bands to analyze price compression and potential trading opportunities.
Explore complementary indicator rolesHow it works
The Dual Bollinger Moving Average combines a 20-day simple moving average with two Bollinger Bands set at different standard deviation levels (0.5 and 1). These bands help visualize price compression and volatility by creating color-coded indicators of market conditions. The bands expand and contract to show the level of price movement relative to the moving average.
The indicator uses color coding to represent different levels of price compression: red for high compression, orange for medium compression, and yellow for low compression. Traders can use these color changes to identify potential trading opportunities, particularly during periods of low volatility that might precede significant price movements.
Why it may be useful
The DBMA provides traders with a comprehensive view of price dynamics by combining trend analysis and volatility measurement in a single indicator. It helps traders identify potential entry points by showing how closely price is tracking the moving average and the level of market compression. This method allows for more precise timing of trades by highlighting periods of low volatility that could precede significant price breakouts.
By using multiple standard deviation bands, the indicator offers a nuanced approach to market analysis. Traders can use the bands to set entry points, manage risk, and identify potential trend changes, making it a versatile tool for understanding market behavior and identifying high-probability trading opportunities.
When to explore it
The Dual Bollinger Moving Average works best in markets with clear trending characteristics and periods of price consolidation. It is particularly effective for pullback traders looking to enter trades when price is close to the moving average and within the Bollinger Bands. The indicator is most useful during times of low volatility, where the squeeze indicator suggests a potential upcoming price movement.
Traders should pay special attention when the band colors change to red, indicating high compression, as this often precedes significant market moves. The DBMA is most effective on timeframes that allow for clear identification of price compression, such as daily or 4-hour charts, and can be applied across various financial markets including stocks, forex, and cryptocurrencies.
Keep exploring
What we’ve verified
Access, alerts and repainting behaviour have not been independently verified for this indicator. Check the creator’s current publication and settings.
General descriptions and classifications are recovered research. Verified details above identify the specific checks we have completed. Check the creator’s current publication for later changes.