A multi-length moving average ribbon with Bollinger Bands that visualizes price trends, volatility, and potential market reversal points using customizable moving average calculations.
Explore complementary indicator rolesHow it works
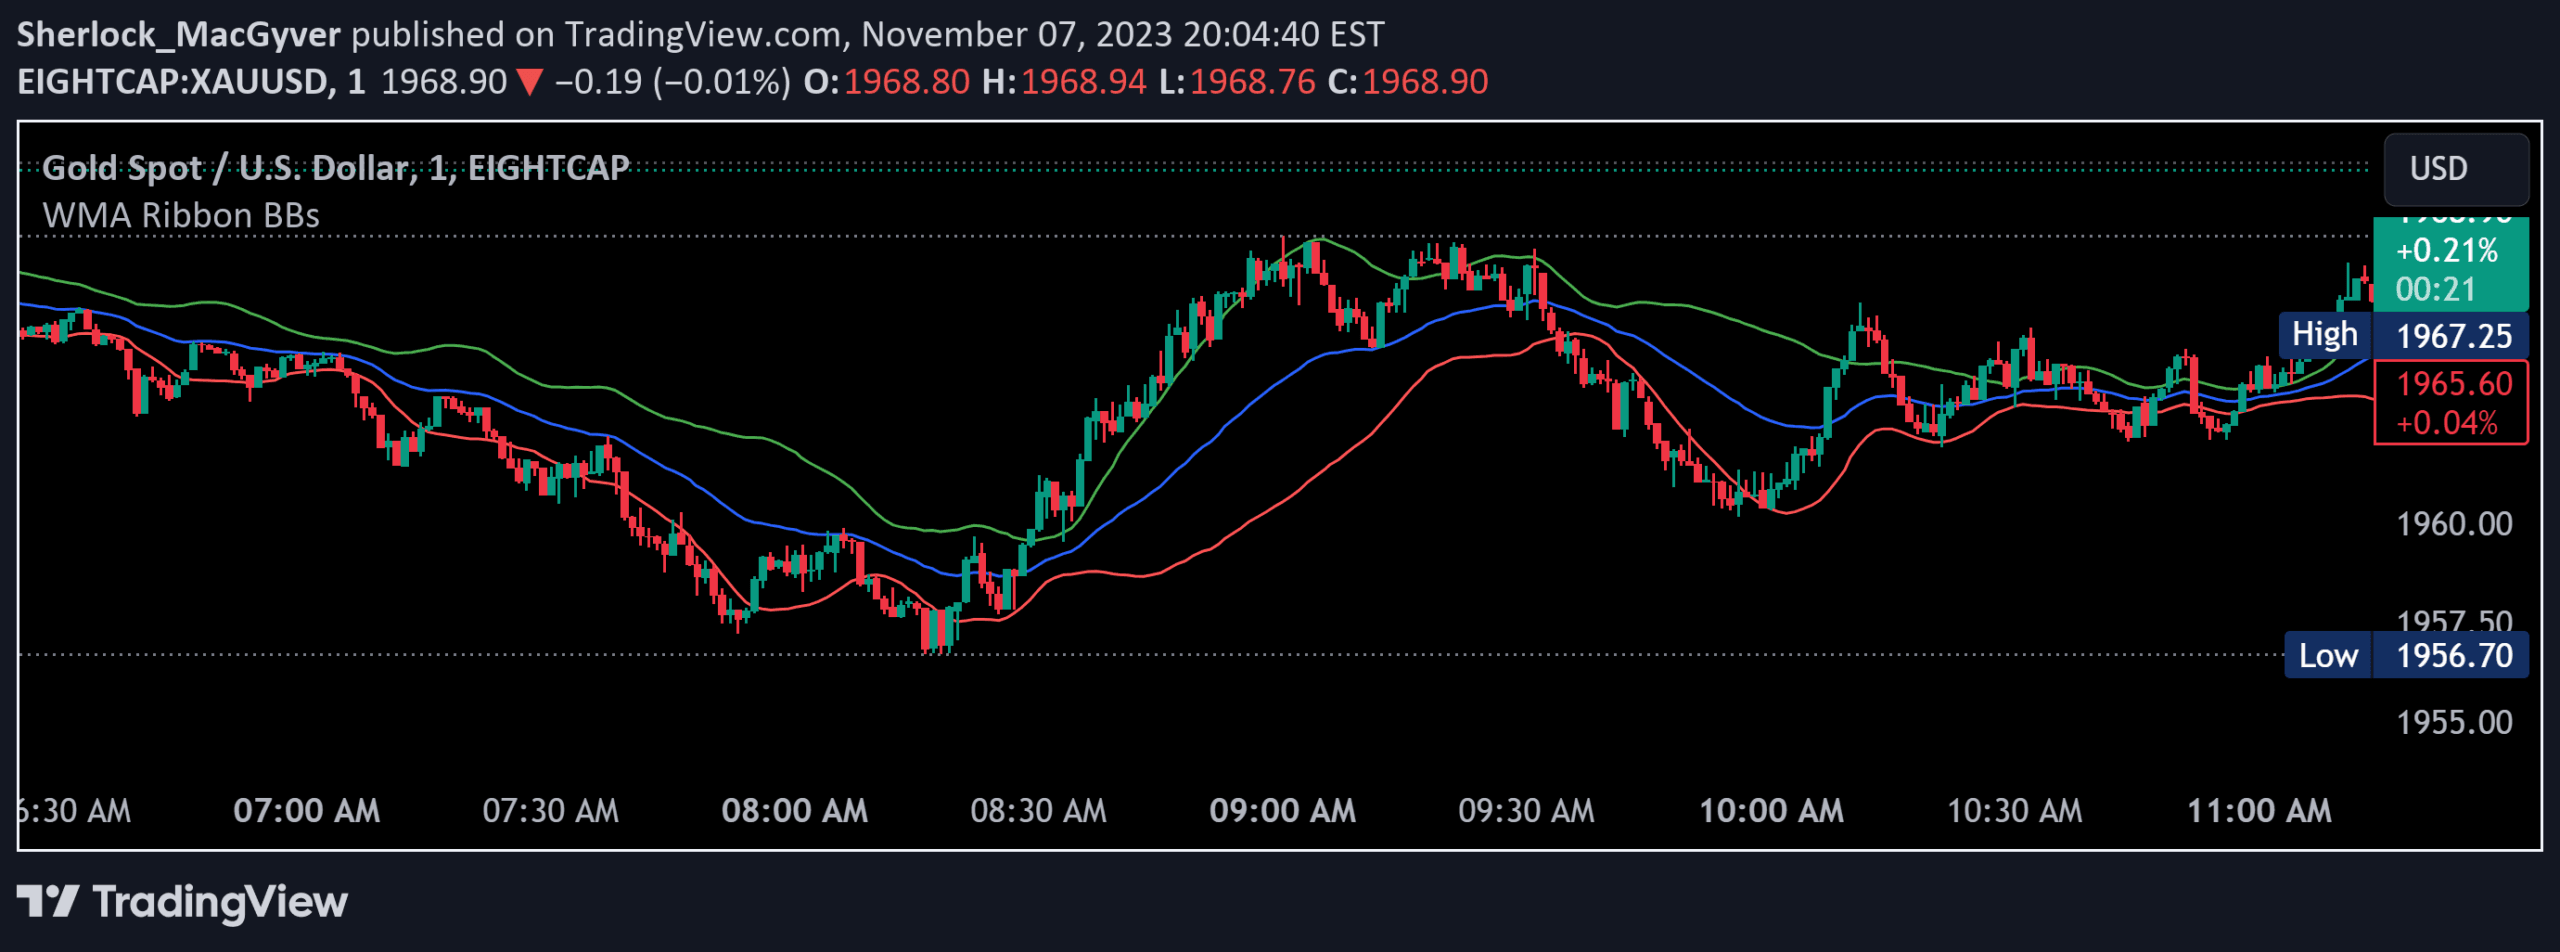
The indicator begins by calculating multiple moving averages using the selected type (WMA, SMA, or EMA) with lengths ranging from 5 to 100. These moving averages are then averaged to create a smooth ribbon that represents underlying price dynamics. The ribbon serves as a visual representation of price trends and momentum across different time frames.
Simultaneously, the indicator calculates Bollinger Bands around this ribbon average, with adjustable deviation settings. The upper (green) and lower (red) bands expand and contract based on price volatility, providing additional context about potential market conditions and price movement ranges.
Why it may be useful
This indicator offers traders a comprehensive view of market trends and volatility by combining multiple moving average lengths into a single ribbon visualization. The multi-layered approach allows traders to observe price momentum, trend strength, and potential reversal points more effectively than traditional single moving average techniques.
By integrating Bollinger Bands with the moving average ribbon, traders gain insights into market volatility and potential overbought or oversold conditions. The flexible design enables customization across different trading styles and timeframes, making it a versatile tool for technical analysis and strategic decision-making.
When to explore it
The moving average ribbon with Bollinger Bands works best in trending markets where price movements show clear directional momentum. Traders can utilize this indicator during periods of consistent price action, particularly when seeking to identify trend strength, potential reversals, and volatility shifts across various financial instruments.
The indicator is particularly useful when traders want to confirm trend directions, assess market volatility, and develop more nuanced entry and exit strategies. It performs optimally on timeframes ranging from short-term scalping to longer-term swing trading, making it adaptable to different trading approaches and market conditions.
Keep exploring
What we’ve verified
Access, alerts and repainting behaviour have not been independently verified for this indicator. Check the creator’s current publication and settings.
General descriptions and classifications are recovered research. Verified details above identify the specific checks we have completed. Check the creator’s current publication for later changes.