The Ultimate Buy and Sell Indicator: Unholy Grail Edition
A comprehensive trading system using machine-engineered signals combining RSI, SuperTrend, and adaptive candle coloring for precise market entry and trend detection.
Explore 11,183 indicators. Filter beyond the obvious.
Discover the tools that fit the way you trade.
11,183 tools to explore
A comprehensive trading system using machine-engineered signals combining RSI, SuperTrend, and adaptive candle coloring for precise market entry and trend detection.
A customized RSI indicator with dual Bollinger Bands that helps traders identify momentum shifts, potential divergences, and market conditions through visual zones and band interactions.
SuperTrend: Silent Shadow is an advanced trend-following system that identifies market direction with dynamic ATR-based lines, offering adaptive noise filtering and structural trend insights.
An advanced RSI-based indicator that combines multiple RSI calculations with smoothing techniques and Bollinger Bands to identify market momentum and potential trading opportunities.
A customized RSI indicator with candlestick visualization, neon glow effect, overbought/oversold zones, and triple moving average buy/sell signals.
A technical analysis tool that identifies market trends and potential trend changes by averaging Detrended Price Oscillator calculations across multiple periods with customizable smoothing.
Voluminati combines volume and price RSI to provide unique market insights, revealing momentum and potential trend reversals through advanced volume analysis.
Unbound RSI transforms traditional RSI into a price-aligned momentum indicator using multi-length analysis and dynamic deoscillation technique for enhanced trend and momentum insights.
A multi-dimensional indicator that measures market volatility and trend direction using scaled volatility ratios, moving averages, and a trend filter to provide comprehensive market analysis.
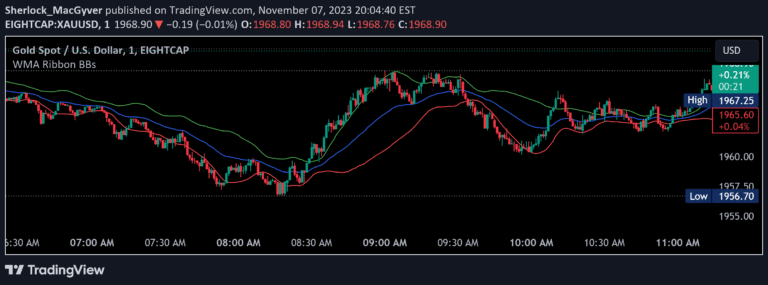
A multi-length moving average ribbon with Bollinger Bands that visualizes price trends, volatility, and potential market reversal points using customizable moving average calculations.
A dynamic, true range-based price visualization framework that adapts to market volatility, providing customizable bands and candle representation beyond traditional technical indicators.
A volume-based drift analyzer that captures directional pressure and trend momentum through adaptive volume flow analysis, revealing hidden market tensions before price movements.
Likes, views, and comments are historical TradingView snapshots. They describe attention, not trading performance.