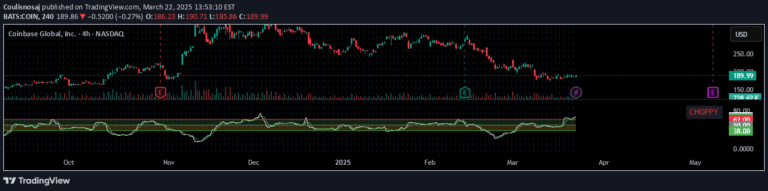
A multi-dimensional indicator that measures market volatility and trend direction using scaled volatility ratios, moving averages, and a trend filter to provide comprehensive market analysis.
Explore complementary indicator rolesHow it works
The Relative Volatility Indicator with Trend Filter (RVI_TF) operates by calculating a scaled volatility ratio that compares current market volatility to historical volatility. It uses Average True Range (ATR) and standard deviation calculations to create this ratio, which is then smoothed using fast and slow moving averages to provide a clearer representation of market volatility trends.
The indicator further enhances its analysis by incorporating a trend filter through a long-term Simple Moving Average (SMA). This additional component helps traders identify the prevailing market trend, allowing for a more comprehensive view of market conditions by combining volatility measurements with directional trend information.
Why it may be useful
The RVI_TF is crucial for traders because it provides a nuanced understanding of market dynamics by simultaneously analyzing volatility and trend direction. By integrating multiple analytical components, the indicator offers insights that go beyond traditional single-dimensional analysis, helping traders make more informed decisions about potential market movements and trading opportunities.
Unlike standalone volatility or trend indicators, this tool offers a holistic approach that can help traders identify potential trend reversals, confirm existing trends, and understand the underlying market volatility. This comprehensive perspective can be particularly valuable in volatile or uncertain market conditions, providing traders with a more robust framework for interpreting market behavior.
When to explore it
The RVI_TF is most effective in markets with clear trending characteristics and notable volatility fluctuations, such as forex, futures, and actively traded stocks. Traders can leverage this indicator during periods of market transition, when volatility is changing, or when seeking to confirm potential trend reversals or continuations.
The indicator is particularly useful in timeframes ranging from short-term intraday trading to longer-term swing trading strategies. Traders should pay special attention to divergences between fast and slow moving averages, color changes in the volatility histogram, and the position of the trend filter line to make more informed trading decisions.
Keep exploring
What we’ve verified
Access, alerts and repainting behaviour have not been independently verified for this indicator. Check the creator’s current publication and settings.
General descriptions and classifications are recovered research. Verified details above identify the specific checks we have completed. Check the creator’s current publication for later changes.