
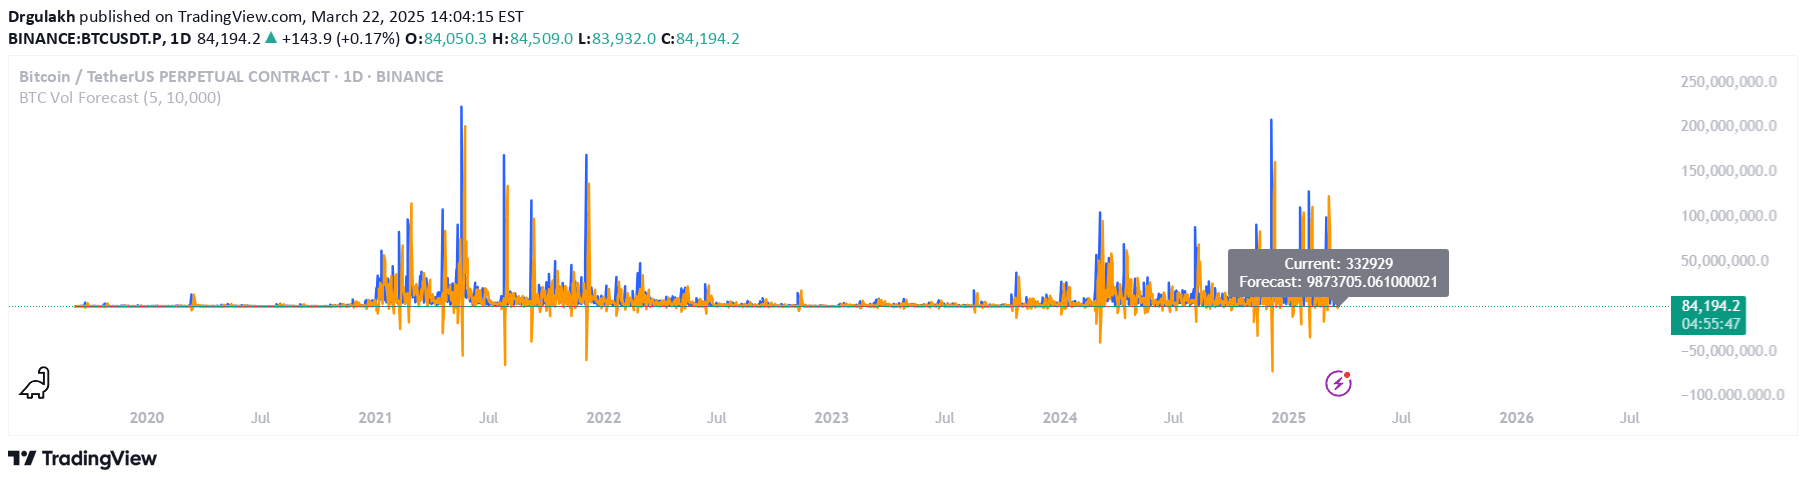
A volatility forecasting indicator for Bitcoin that calculates daily price range variance and predicts potential market turbulence using a linear regression model over historical data.
Explore complementary indicator rolesHow it works
The BTC Volatility Forecast indicator analyzes historical daily price ranges by calculating realized variance through squared differences between daily high and low prices. It applies a linear regression model over five days of variance data to project the next day's potential volatility. The indicator generates two primary lines: a blue solid line representing current realized variance and an orange line showing the forecasted volatility.
Traders can customize the lag period to adjust the analysis timeframe. The method involves computing daily price fluctuations and extrapolating future market turbulence based on recent historical patterns. By tracking these variance calculations, the indicator provides a quantitative view of potential price movements
Why it may be useful
Understanding market volatility is crucial for effective trading strategy and risk management. This indicator helps traders anticipate potential price fluctuations in Bitcoin, allowing for more informed decision-making. By providing a numerical forecast of market turbulence, it enables traders to adjust their positions proactively.
The visualization of current and projected volatility offers insights into market dynamics that might not be immediately apparent from price charts alone. Traders can use this information to set appropriate stop-loss levels, determine position sizes, and manage potential risks. The indicator bridges the gap between historical price data and future market expectations
When to explore it
The BTC Volatility Forecast is most effective during periods of market uncertainty or significant economic events. It works best when traders need to assess potential price range and market turbulence before making trading decisions. The indicator is particularly useful for cryptocurrency traders who want to understand Bitcoin's potential price movements.
It can be valuable during high-impact news events, market transitions, or when analyzing trend changes. Traders should use this indicator in conjunction with other technical analysis tools to confirm signals and make more comprehensive trading strategies. The forecast is especially relevant for swing traders and day traders seeking to manage risk
Keep exploring
What we’ve verified
Access, alerts and repainting behaviour have not been independently verified for this indicator. Check the creator’s current publication and settings.
General descriptions and classifications are recovered research. Verified details above identify the specific checks we have completed. Check the creator’s current publication for later changes.


