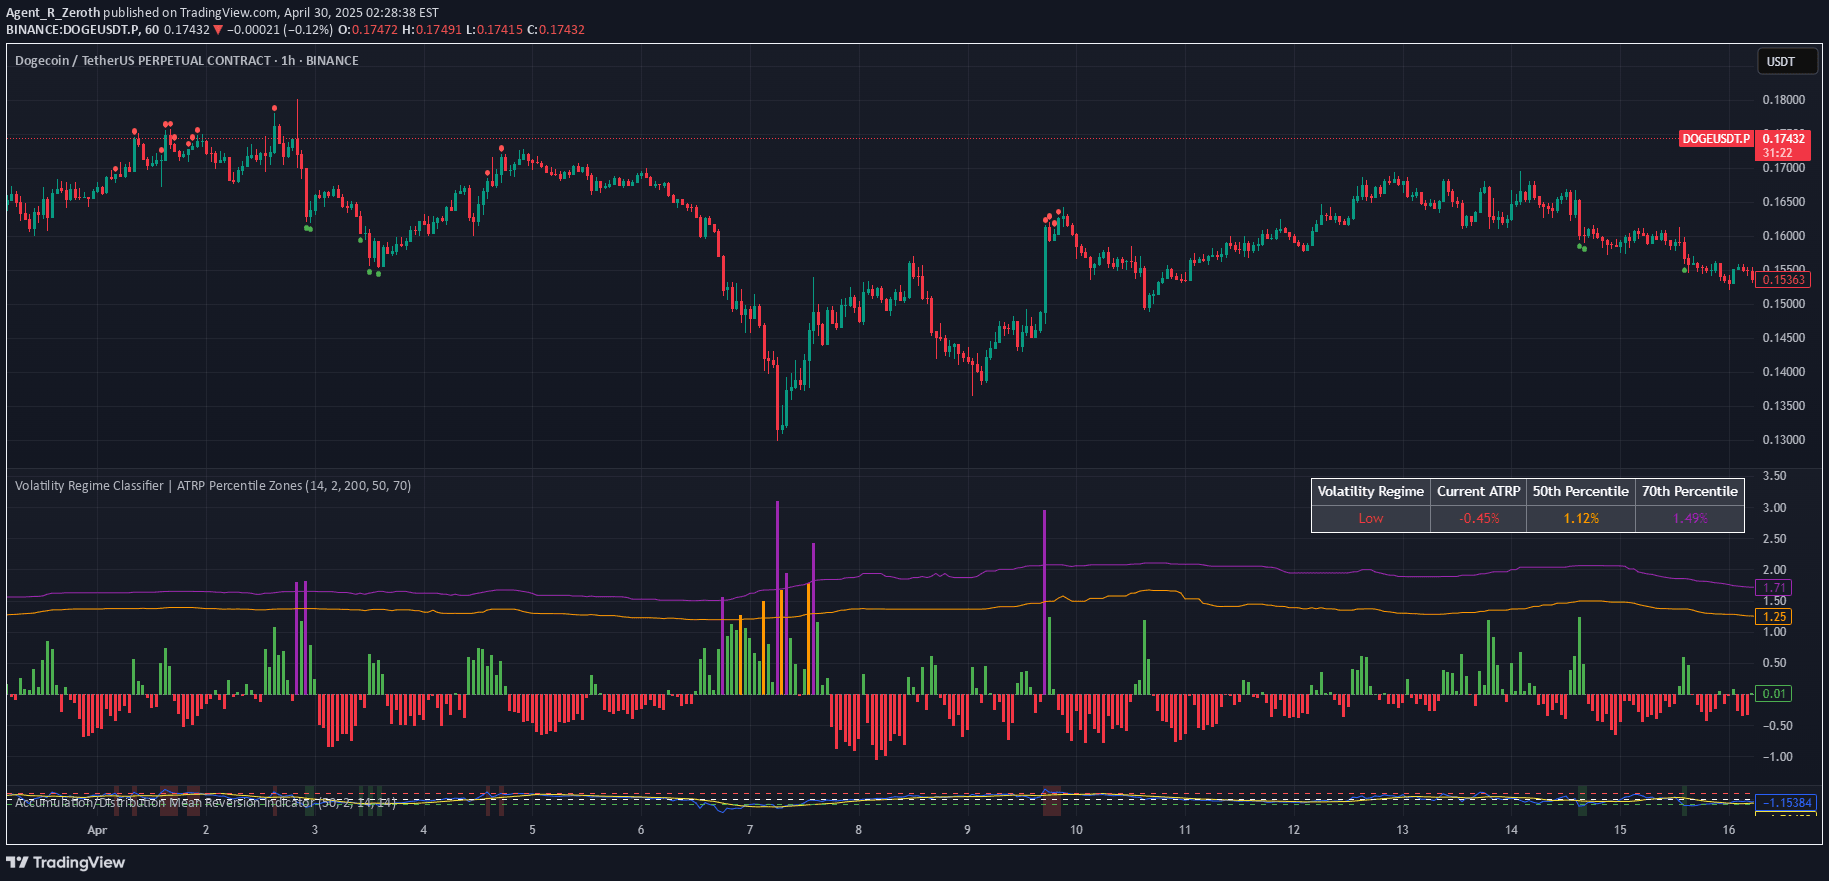
Relative Volatility compares fast and slow Average True Range values to assess market volatility changes, helping traders identify shifts in market activity and potential trading opportunities.
Explore complementary indicator rolesHow it works
Relative Volatility operates by calculating two different period Average True Range (ATR) values - a faster short-term ATR and a slower long-term ATR. The indicator subtracts the slower ATR from the faster ATR, presenting the difference as a histogram that visually represents volatility changes.
When the histogram is above zero, it indicates the fast ATR is greater than the slow ATR, signaling increased short-term volatility. Conversely, when the histogram is below zero, it suggests the fast ATR is less than the slow ATR, indicating decreased short-term volatility relative to the long-term average.
Why it may be useful
Relative Volatility provides traders with a dynamic tool to understand market volatility trends, which is crucial for making informed trading decisions. By revealing changes in market activity, traders can better anticipate potential price movements and adjust their strategies accordingly.
The indicator helps traders manage risk by highlighting periods of increasing or decreasing market volatility. This insight allows traders to modify position sizing, set more appropriate stop-loss levels, and identify potential entry and exit points based on the current market volatility environment.
When to explore it
Relative Volatility is most effective during periods of market transition, where volatility is shifting between high and low states. Traders can use this indicator to identify potential breakout opportunities, confirm trend strength, and assess market conditions before entering trades.
The indicator is particularly useful in markets experiencing significant economic events, news releases, or sector-specific changes that might impact price volatility. Traders can leverage this tool across various financial instruments, including stocks, forex, commodities, and cryptocurrencies, to gain a comprehensive understanding of market dynamics.
Keep exploring
What we’ve verified
Access, alerts and repainting behaviour have not been independently verified for this indicator. Check the creator’s current publication and settings.
General descriptions and classifications are recovered research. Verified details above identify the specific checks we have completed. Check the creator’s current publication for later changes.