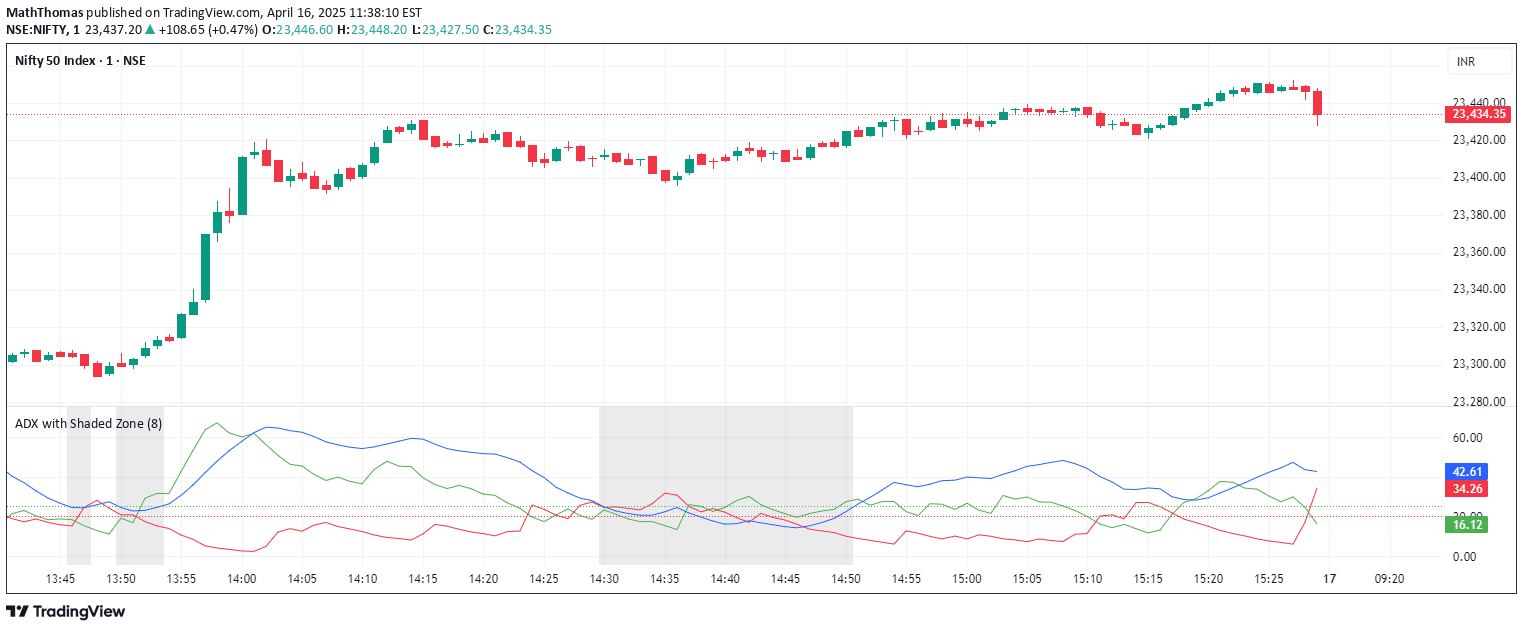
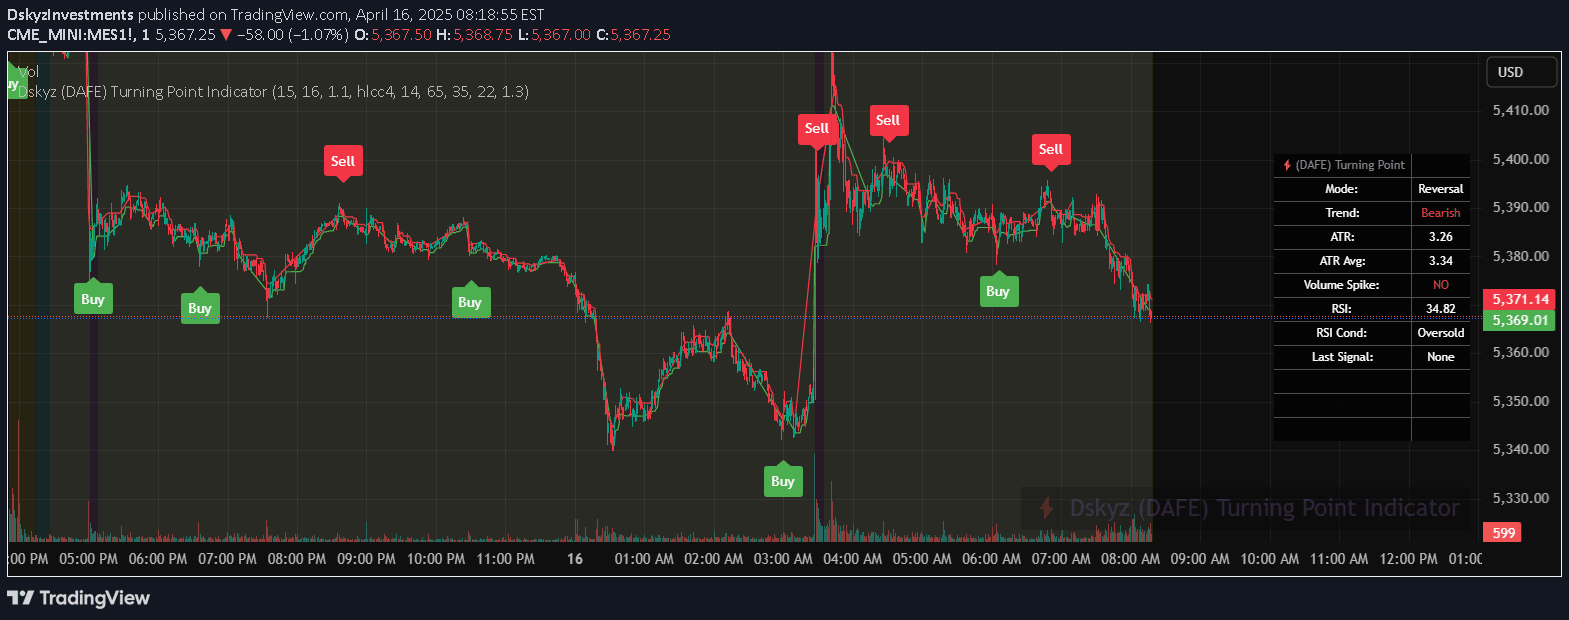
ADW Volatility Map uses ATR, TR, and CCI to measure market volatility, providing traders with a comprehensive visual tool to understand price fluctuations and market conditions.
Explore complementary indicator rolesHow it works
The ADW Volatility Map script integrates multiple technical indicators to assess market volatility dynamically. It calculates the Average True Range (ATR) and True Range (TR) and then applies the Commodity Channel Index (CCI) to provide a nuanced interpretation of market movement.
By comparing ATR and TR values against CCI thresholds, the script categorizes volatility into four distinct conditions: low, high, extremely low, and extremely high. These conditions are visually represented through color-coded chart highlighting, allowing traders to quickly understand the current market volatility state.
Why it may be useful
Understanding market volatility is crucial for traders to manage risk and adapt their strategies effectively. The ADW Volatility Map provides a comprehensive and visual representation of price fluctuations, enabling traders to make more informed decisions based on the current market environment.
By combining multiple indicators like ATR, TR, and CCI, the script offers a multi-dimensional view of market dynamics. This holistic approach helps traders identify potential trend changes, assess market stability, and recognize periods of increased or decreased price movement with greater precision.
When to explore it
The ADW Volatility Map is most effective during periods of market uncertainty or when traders need a quick, comprehensive view of price volatility. It can be particularly useful during economic announcements, earnings reports, or significant market events that might cause sudden price fluctuations.
Traders can leverage this tool across various timeframes and asset classes, from stocks and forex to cryptocurrencies. The script's flexibility allows it to adapt to different market conditions, making it valuable for scalpers, day traders, and swing traders seeking to understand and anticipate potential market movements.
Keep exploring
What we’ve verified
Access, alerts and repainting behaviour have not been independently verified for this indicator. Check the creator’s current publication and settings.
General descriptions and classifications are recovered research. Verified details above identify the specific checks we have completed. Check the creator’s current publication for later changes.