
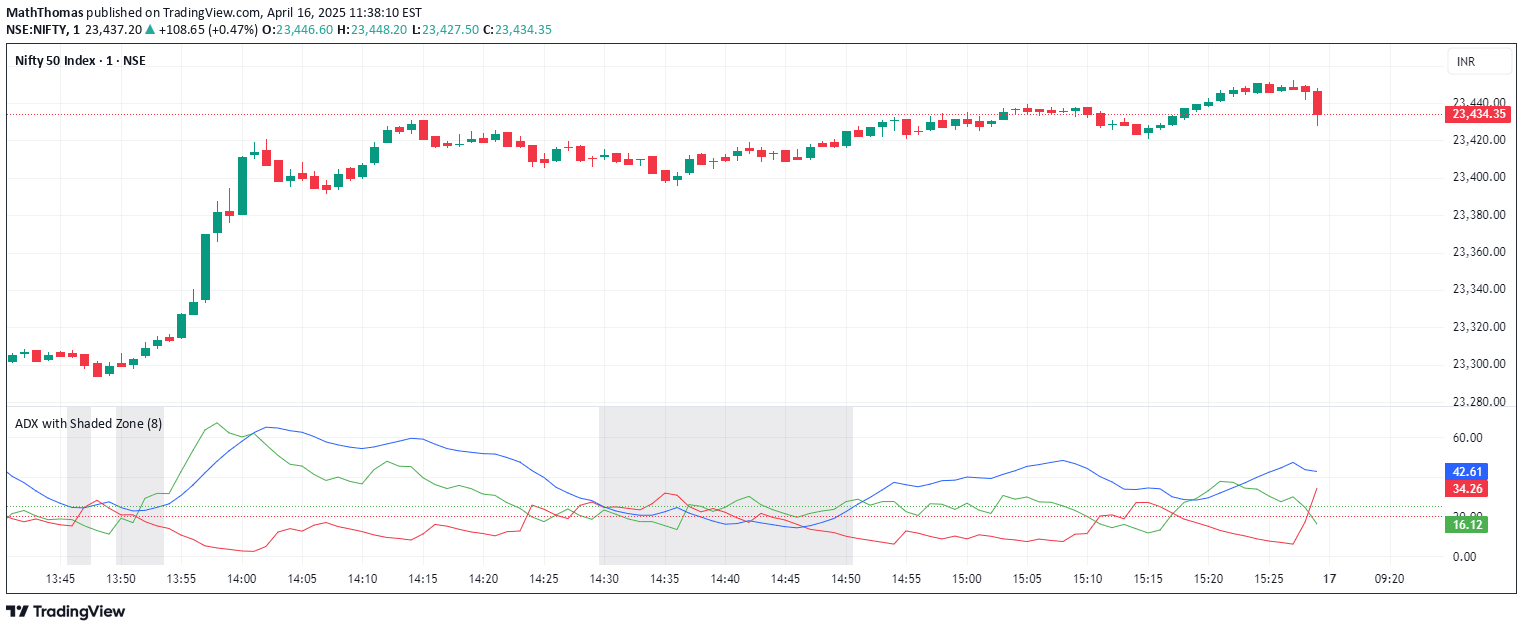
ADX with Shaded Zone is a momentum indicator that measures trend strength through Directional Indicators, helping traders identify trend quality and potential market transitions.
Explore complementary indicator rolesHow it works
The ADX with Shaded Zone indicator calculates trend strength by analyzing three key lines: +DI (green), -DI (red), and ADX (blue). The system tracks the relationship between positive and negative directional indicators to determine market momentum.
When the ADX rises above 25, it signals a strong trend, while values below 20 indicate a weak or non-trending market. The unique shaded zone between 20-25 represents a transition period where traders can anticipate potential trend formation and prepare for potential market movements.
Why it may be useful
The ADX with Shaded Zone provides traders with a nuanced view of market trends, helping them distinguish between strong and weak market conditions. By offering clear visual cues about trend strength, traders can make more informed decisions about entering or exiting positions.
The indicator's multi-layered approach allows traders to avoid trading during low-momentum periods and focus on markets with clear directional movement. Its ability to differentiate between trend quality makes it a valuable tool for understanding market dynamics and potential trading opportunities.
When to explore it
The ADX with Shaded Zone is most effective in markets with clear directional movements, particularly in trending financial instruments like stocks, forex, and futures. Traders should use this indicator when seeking to confirm trend strength and potential trend reversals.
It works best when combined with other technical analysis tools, providing additional context for trading decisions. The indicator is particularly useful during periods of market transition, helping traders identify when a potential trend is forming and determining the optimal time to enter or exit a trade.
Keep exploring
What we’ve verified
Access, alerts and repainting behaviour have not been independently verified for this indicator. Check the creator’s current publication and settings.
General descriptions and classifications are recovered research. Verified details above identify the specific checks we have completed. Check the creator’s current publication for later changes.


