Math by Thomas Liquidity Pool
A TradingView indicator that identifies potential liquidity pools by detecting areas with clustered equal highs or lows, helping traders anticipate price reactions and stop loss zones.
Explore 11,183 indicators. Filter beyond the obvious.
Discover the tools that fit the way you trade.
11,183 tools to explore
A TradingView indicator that identifies potential liquidity pools by detecting areas with clustered equal highs or lows, helping traders anticipate price reactions and stop loss zones.
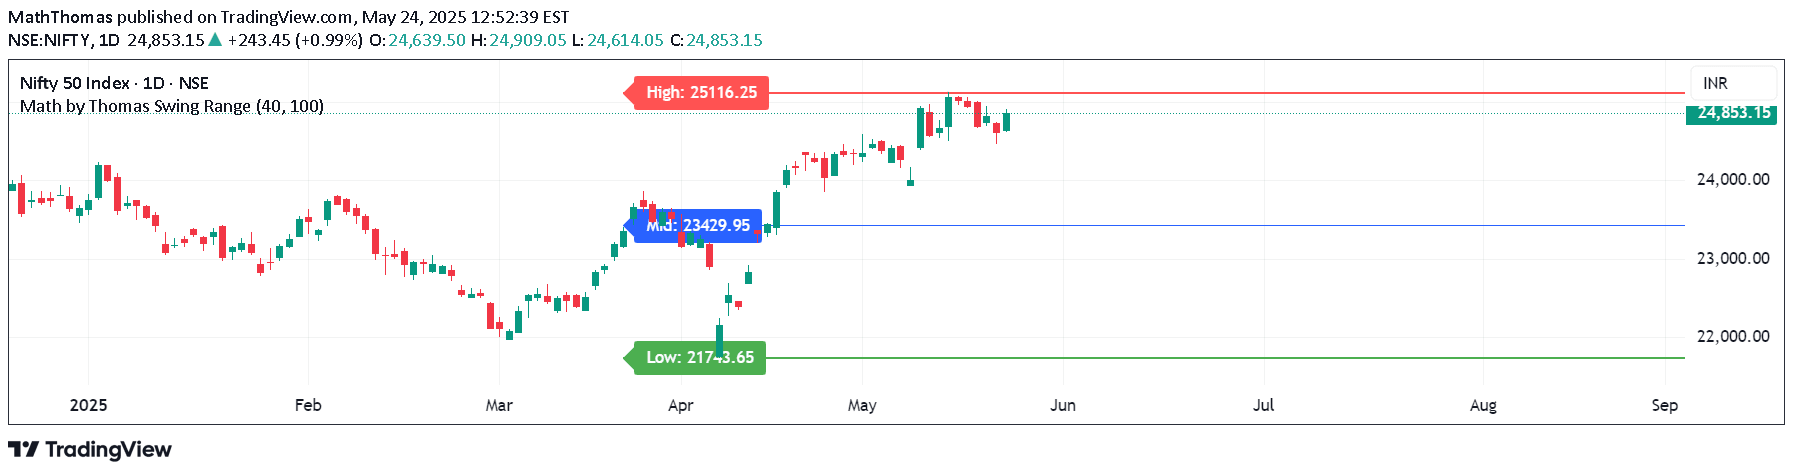
A swing range indicator that identifies key market levels by calculating the highest high, lowest low, and midpoint over a specified lookback period to help traders analyze potential support and resistance zones.
A market structure tool that identifies swing highs and lows, classifying price action movements and detecting trend continuations or reversals through Break of Structure and Change of Character.
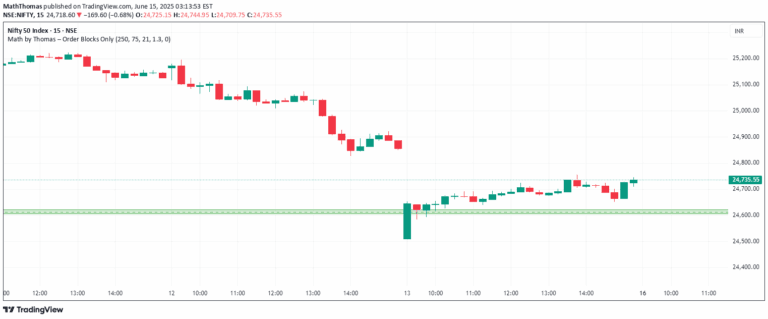
A precision trading tool that automatically detects Order Blocks (OBs) to identify institutional trading zones, highlighting potential reversal and continuation areas for price action traders.
A customizable Volume Weighted Average Price (VWAP) indicator that allows traders to anchor from specific points, tracking institutional pricing zones and market dynamics.
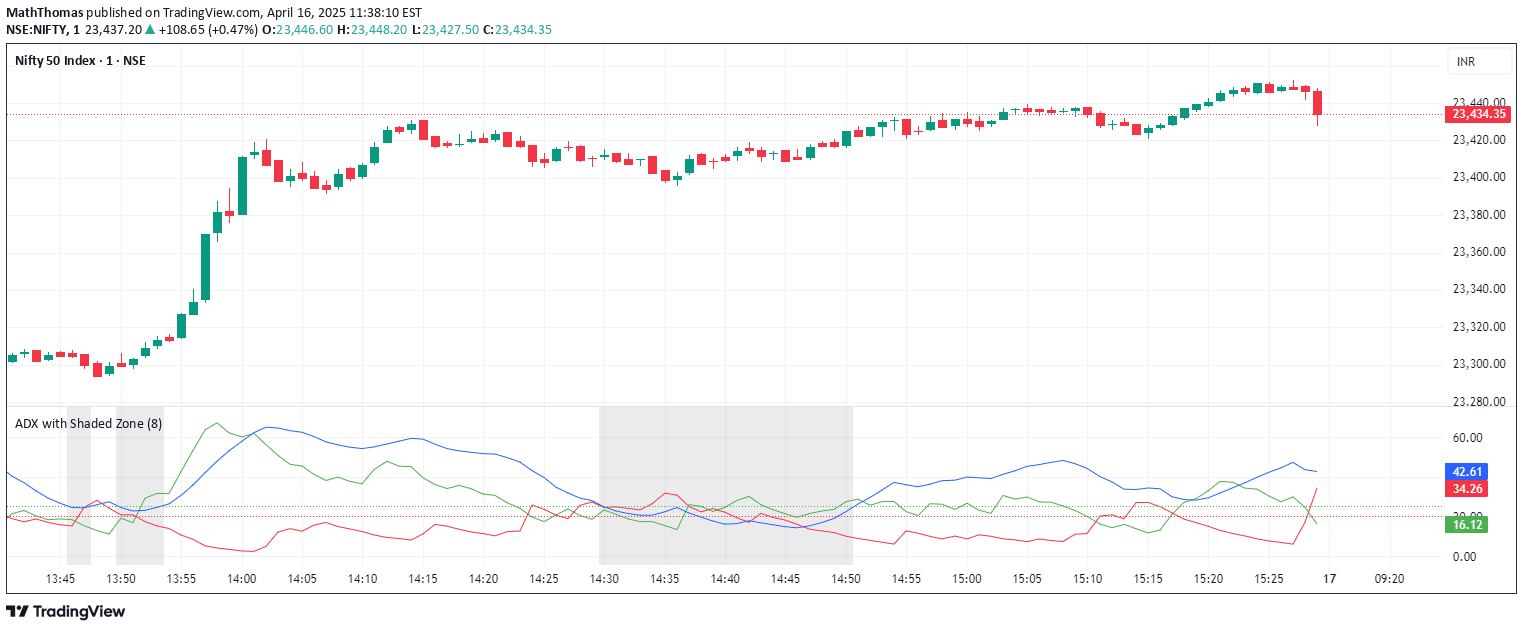
ADX with Shaded Zone is a momentum indicator that measures trend strength through Directional Indicators, helping traders identify trend quality and potential market transitions.
A trading indicator that identifies Fair Value Gaps in market price action, highlighting potential support and resistance zones by detecting price inefficiencies across three consecutive candles.
Likes, views, and comments are historical TradingView snapshots. They describe attention, not trading performance.