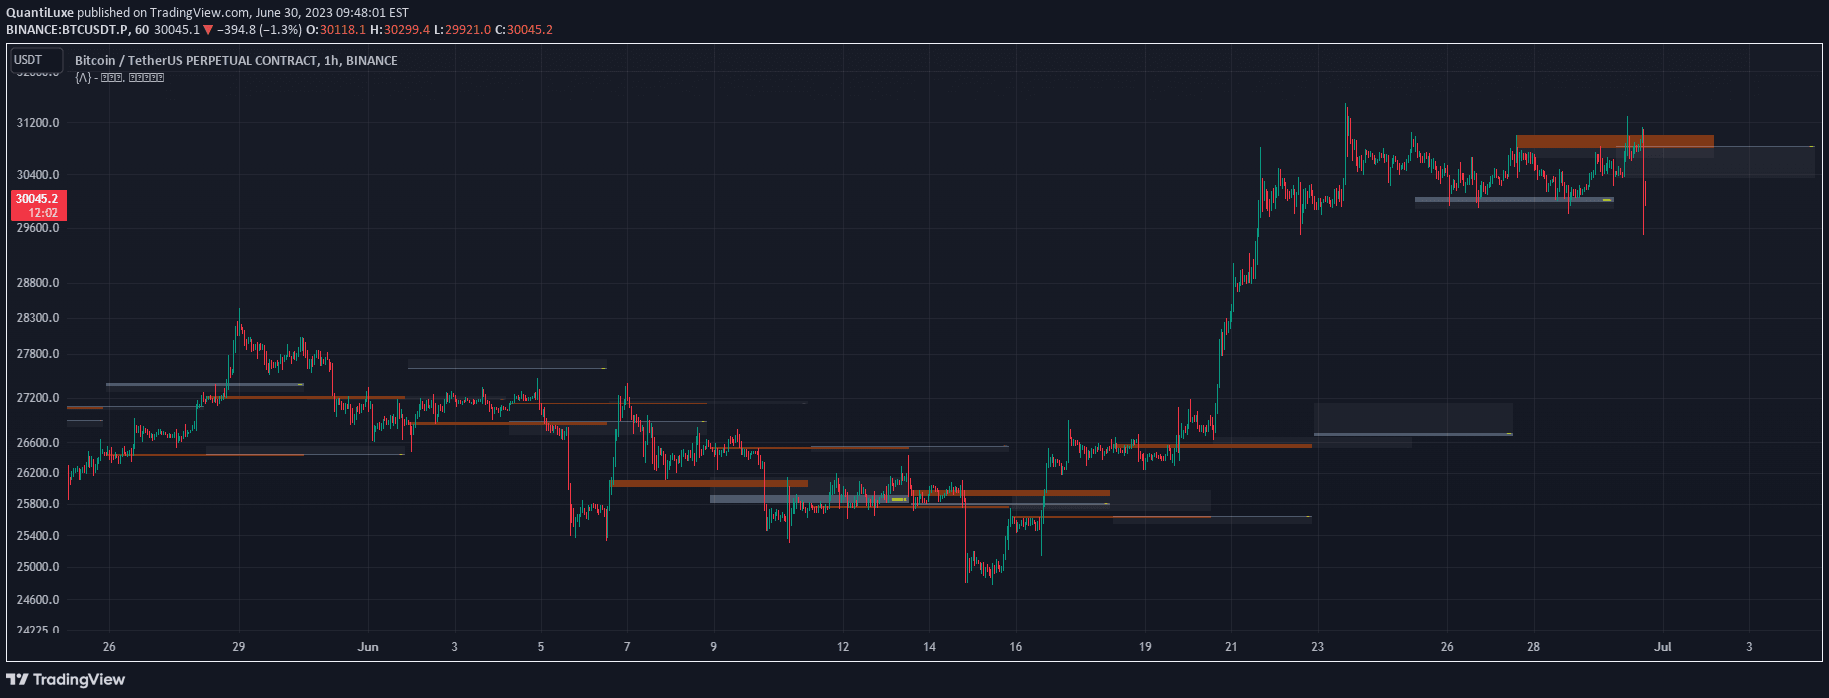
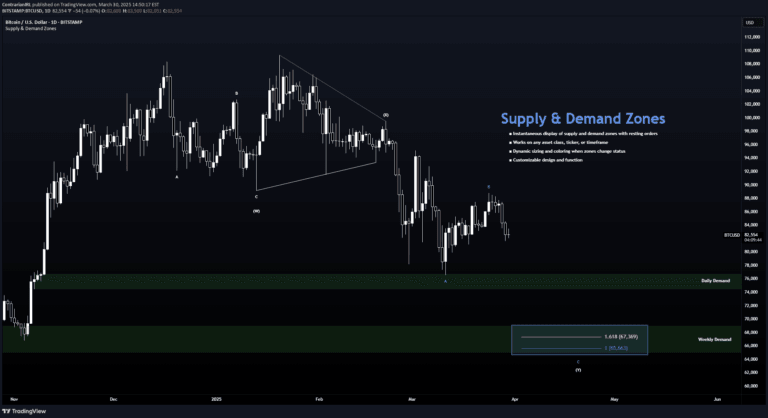
A TradingView indicator that identifies potential liquidity pools by detecting areas with clustered equal highs or lows, helping traders anticipate price reactions and stop loss zones.
Explore complementary indicator rolesHow it works
The Math by Thomas Liquidity Pool indicator analyzes adjacent candles to identify areas where price forms similar highs or lows within a specified threshold. For bullish liquidity pools, it marks green boxes below price where two adjacent candles have nearly identical low points, indicating potential demand zones or stop loss clusters.
For bearish liquidity pools, the indicator creates red boxes above price where two adjacent candles have similar high points. These zones are determined by the user-defined parameters, including maximum difference threshold and box height, allowing customization to different trading instruments and market conditions.
Why it may be useful
Liquidity pool indicators provide crucial insights into potential market manipulation and smart money movements by highlighting areas where stop losses are likely clustered. They help traders understand where significant price reactions might occur, revealing hidden market dynamics that are not immediately apparent from standard price charts.
By visualizing these potential liquidity zones, traders can make more informed decisions about trade entries, exits, and risk management. The indicator helps identify areas where large market participants might intentionally trigger stop losses, providing a strategic advantage in understanding potential price movements.
When to explore it
This indicator works best in markets with clear support and resistance levels, such as index futures, forex, and liquid stock markets. Traders should use it most effectively when combining it with other technical analysis tools like order block and market structure analysis to confirm potential trade setups.
The liquidity pool indicator is particularly useful during range-bound and trending markets, helping traders anticipate potential breakout or reversal points. It is most valuable when applied to timeframes that provide sufficient context, such as 1-hour, 4-hour, and daily charts, where liquidity zones can be more meaningful and reliable.
Keep exploring
What we’ve verified
Access, alerts and repainting behaviour have not been independently verified for this indicator. Check the creator’s current publication and settings.
General descriptions and classifications are recovered research. Verified details above identify the specific checks we have completed. Check the creator’s current publication for later changes.