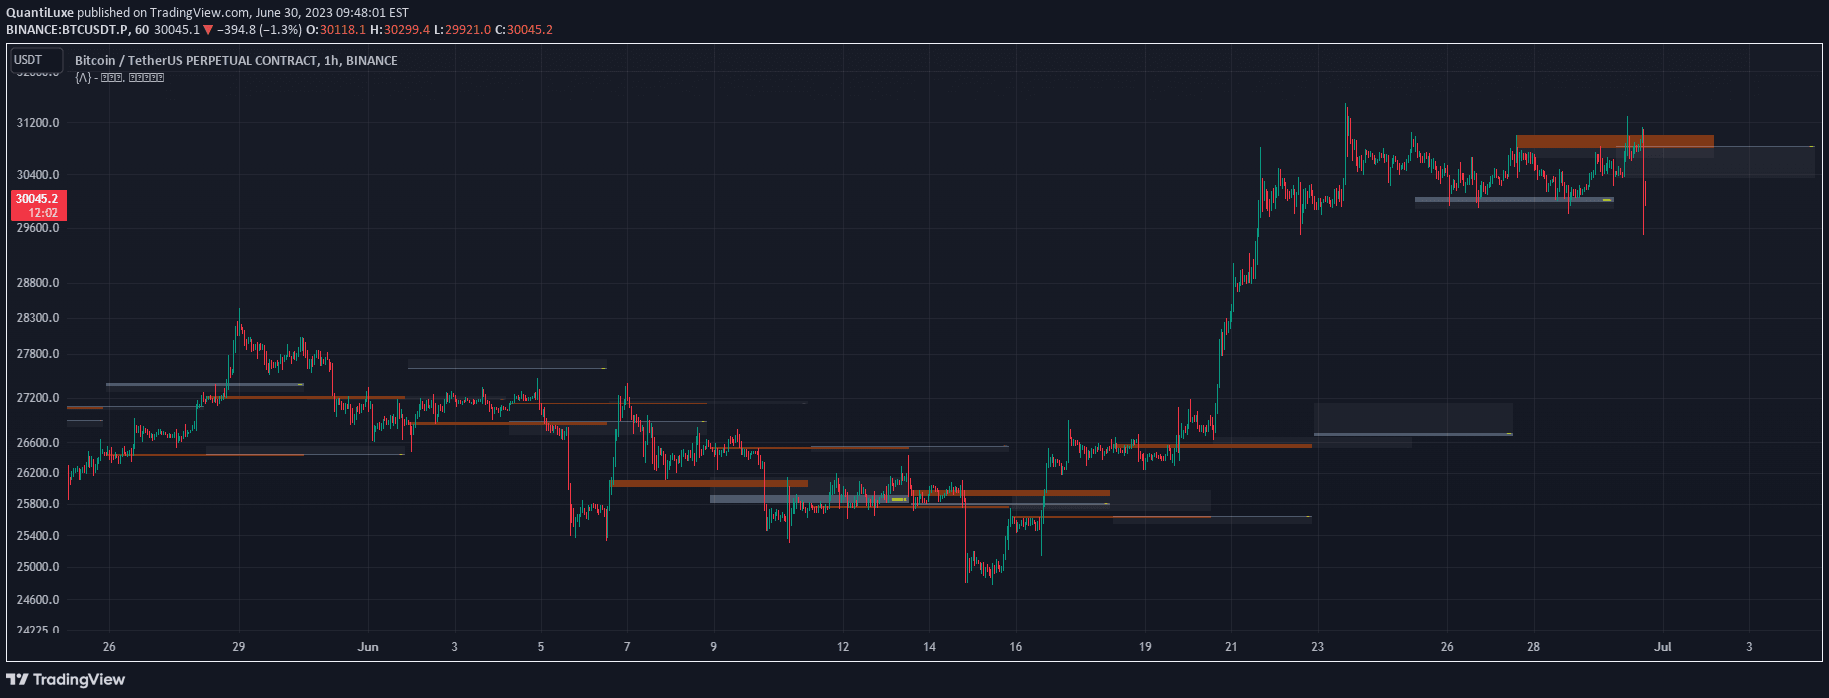
Draw on Liquidity (DOL) is an advanced technical analysis tool identifying significant market liquidity zones through volume analysis, pivot detection, and real-time proximity alerts.
Explore complementary indicator rolesHow it works
The Draw on Liquidity indicator processes market data through three core components: liquidity detection, volume analysis, and proximity tracking. It begins by identifying pivot points using customizable lookback periods, then validates these levels through comprehensive volume analysis to filter out low-significance zones.
The system calculates dynamic volume thresholds by comparing current trading volume against moving averages, ensuring only meaningful liquidity zones are highlighted. Additionally, it monitors price proximity to these zones, triggering real-time alerts and updating its comprehensive dashboard to provide traders with actionable insights into potential support and resistance levels.
Why it may be useful
The Draw on Liquidity indicator is crucial for traders seeking to understand market structure and potential turning points with greater precision. By integrating volume validation with pivot point analysis, it offers a more robust method of identifying significant trading levels beyond traditional technical analysis techniques.
Its unique dual-mode visualization and adaptive threshold system allow traders to customize their analysis approach, providing flexibility across different market conditions and trading styles. The comprehensive dashboard transforms complex market data into clear, actionable visual information, enabling more informed trading decisions.
When to explore it
The Draw on Liquidity indicator performs optimally in markets with consistent volume and clear trend structures, making it particularly effective during regular trading hours with stable market participation. It is most valuable when traders want to identify high-probability entry and exit points based on significant liquidity zones.
Traders should consider using this indicator across multiple timeframes for confirmation, starting with default settings and gradually adapting parameters to suit their specific trading style and market environment. It is especially useful when combined with additional price action analysis to validate potential trade setups.
Keep exploring
What we’ve verified
Access, alerts and repainting behaviour have not been independently verified for this indicator. Check the creator’s current publication and settings.
General descriptions and classifications are recovered research. Verified details above identify the specific checks we have completed. Check the creator’s current publication for later changes.