
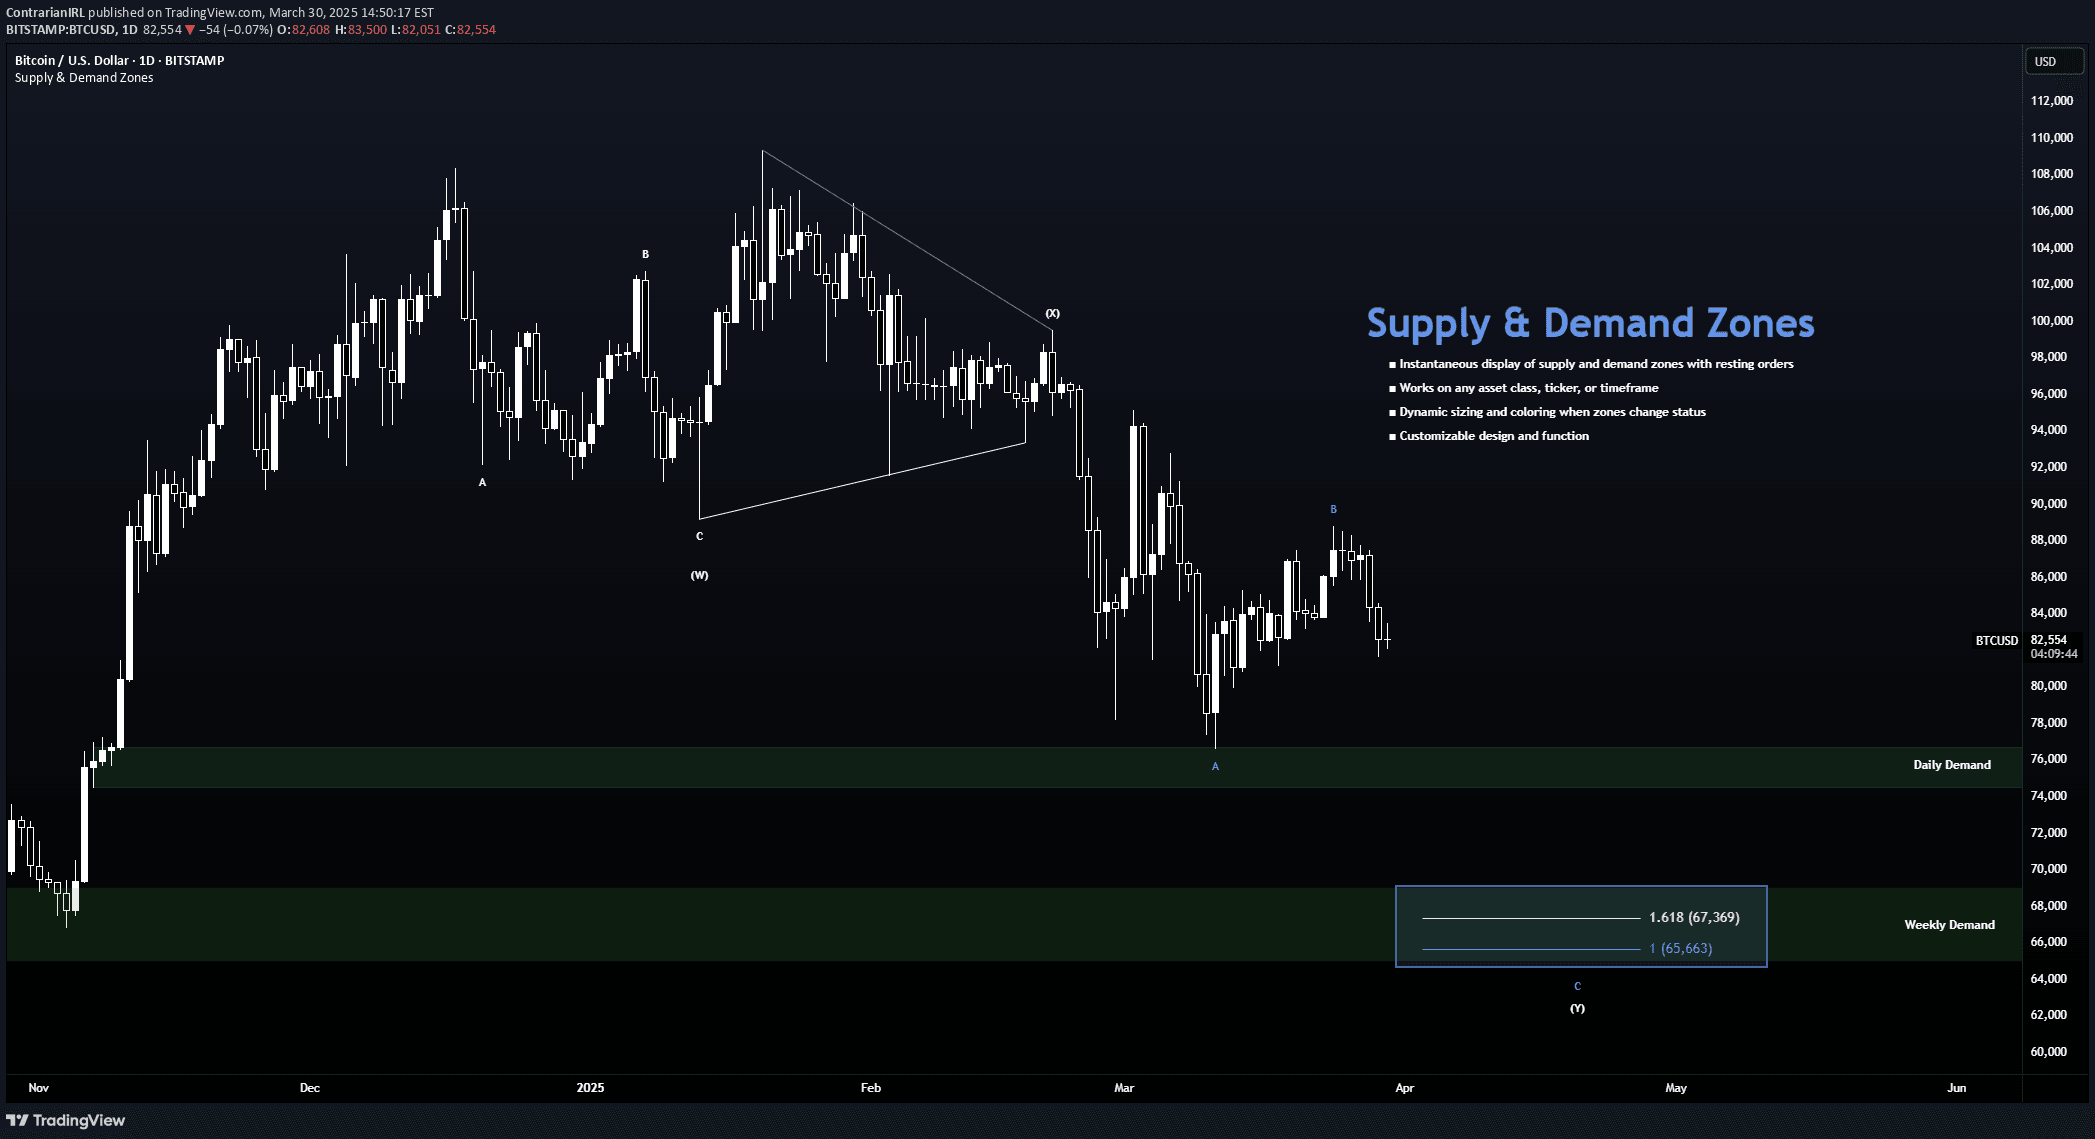
A trading indicator that identifies high-probability supply and demand zones on charts, helping traders locate potential price reversal areas with dynamic visual representation and customizable settings.
Explore complementary indicator rolesHow it works
The Supply and Demand indicator dynamically tracks and displays zones where significant buying or selling interest might exist. It uses a precise candle sequence logic to validate these zones, showing them as color-coded boxes on the chart.
When a zone is first detected, it appears as a valid zone. As price interacts with the zone, it transitions through used and invalidated states. The indicator automatically manages zone display based on recent price action, helping traders quickly identify potential reversal points
Why it may be useful
This indicator provides traders with a visual representation of potential order accumulation areas, offering insights beyond traditional support and resistance techniques. By highlighting supply and demand zones, traders can make more informed entry and exit decisions.
The dynamic nature of the indicator allows real-time tracking of zone status, helping traders understand market psychology and potential price movement. It enhances technical analysis by providing a structured approach to identifying high-probability trading opportunities
When to explore it
The Supply and Demand indicator works best when integrated into a comprehensive trading system. It is most effective during trending markets with clear directional movements. Traders should use it in conjunction with other technical analysis tools to confirm potential trade setups.
The indicator is particularly useful for identifying pullback entries, validating trend continuation, and understanding market structure. It requires practice and a deep understanding of supply and demand concepts to be used effectively
Keep exploring
What we’ve verified
Access, alerts and repainting behaviour have not been independently verified for this indicator. Check the creator’s current publication and settings.
General descriptions and classifications are recovered research. Verified details above identify the specific checks we have completed. Check the creator’s current publication for later changes.


