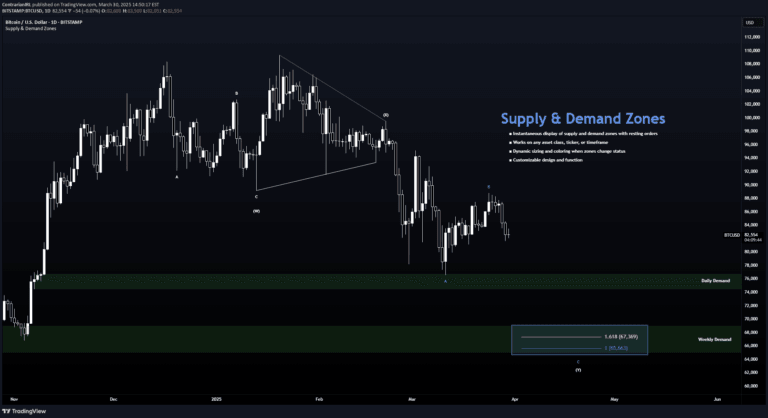
A technical analysis tool that identifies price inefficiencies by detecting Fair Value Gaps, highlighting areas with little to no traded volume using color-coded boxes on the chart.
Explore complementary indicator rolesHow it works
The Imbalance (FVG) Detector analyzes price movement using a three-bar structure to identify market inefficiencies. For bullish imbalances, it checks if the high three bars ago is lower than the previous bar's low. Bearish imbalances occur when the low three bars ago is higher than the previous bar's high.
The indicator automatically marks these gaps as colored boxes on the chart. Green boxes represent bullish imbalances, while red boxes show bearish imbalances. As price interacts with these zones, the boxes fade to gray, indicating they have been tested
Why it may be useful
The Imbalance Detector provides traders with a visual representation of price inefficiencies and potential liquidity zones. By highlighting areas with little to no trading volume, it helps traders identify potential support and resistance levels. These imbalance zones can reveal hidden market dynamics and potential entry or exit points.
The tool is particularly valuable in volatile markets like cryptocurrency, where rapid price movements can create significant gaps. It offers a structured approach to understanding market structure and price behavior beyond traditional technical analysis methods
When to explore it
The Imbalance (FVG) Detector is most effective in volatile markets with significant price movements, such as cryptocurrency and high-volatility stocks. Traders should use it alongside other technical analysis tools to confirm potential trading opportunities. It works best during periods of rapid price changes and market transitions.
The indicator is particularly useful for identifying potential support and resistance zones in trending markets. Traders can adjust the sensitivity to match different asset characteristics and market conditions. It's most valuable when combined with comprehensive market analysis and risk management strategies
Keep exploring
What we’ve verified
Access, alerts and repainting behaviour have not been independently verified for this indicator. Check the creator’s current publication and settings.
General descriptions and classifications are recovered research. Verified details above identify the specific checks we have completed. Check the creator’s current publication for later changes.