
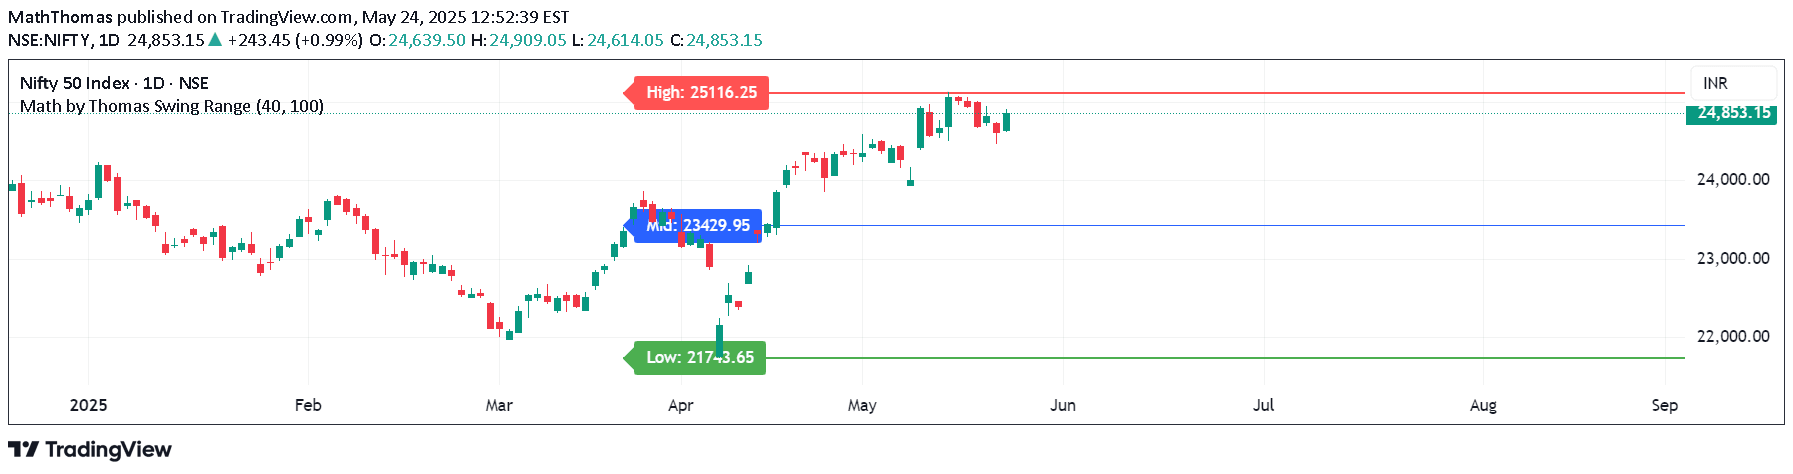
A swing range indicator that identifies key market levels by calculating the highest high, lowest low, and midpoint over a specified lookback period to help traders analyze potential support and resistance zones.
Explore complementary indicator rolesHow it works
The Math by Thomas Swing Range indicator analyzes price action over a user-defined lookback period, typically 20 candles, to identify the highest high and lowest low within that timeframe. It then creates three key visual lines: a red resistance line at the swing high, a green support line at the swing low, and a blue midpoint line representing the market's equilibrium level.
The indicator continuously updates these lines and can extend them into the future, providing traders with a dynamic visual representation of potential price boundaries. By calculating these levels, the tool helps traders quickly understand the current market structure and potential areas of price interaction.
Why it may be useful
The swing range indicator is crucial for traders because it offers a clear, visual method of identifying key market levels that can guide trading decisions. By highlighting support and resistance zones, the tool helps traders understand potential price rejection areas and market dynamics more intuitively.
These levels provide traders with valuable insights into market structure, allowing them to make more informed decisions about potential entry and exit points. The indicator's ability to project levels into the future also helps traders plan and anticipate potential market movements before they occur.
When to explore it
The Math by Thomas Swing Range indicator works best on higher timeframes such as 1-hour, 4-hour, or daily charts, where swing levels become more meaningful and reliable. It is particularly useful in markets with clear trending or ranging characteristics, where support and resistance levels play a significant role in price action.
Traders can leverage this tool for various strategies, including bounce trades from swing high/low zones, breakout confirmations, and mean reversion trades. The indicator is especially valuable when combined with other technical analysis tools to validate trading signals and improve overall trade management.
Keep exploring
What we’ve verified
Access, alerts and repainting behaviour have not been independently verified for this indicator. Check the creator’s current publication and settings.
General descriptions and classifications are recovered research. Verified details above identify the specific checks we have completed. Check the creator’s current publication for later changes.


