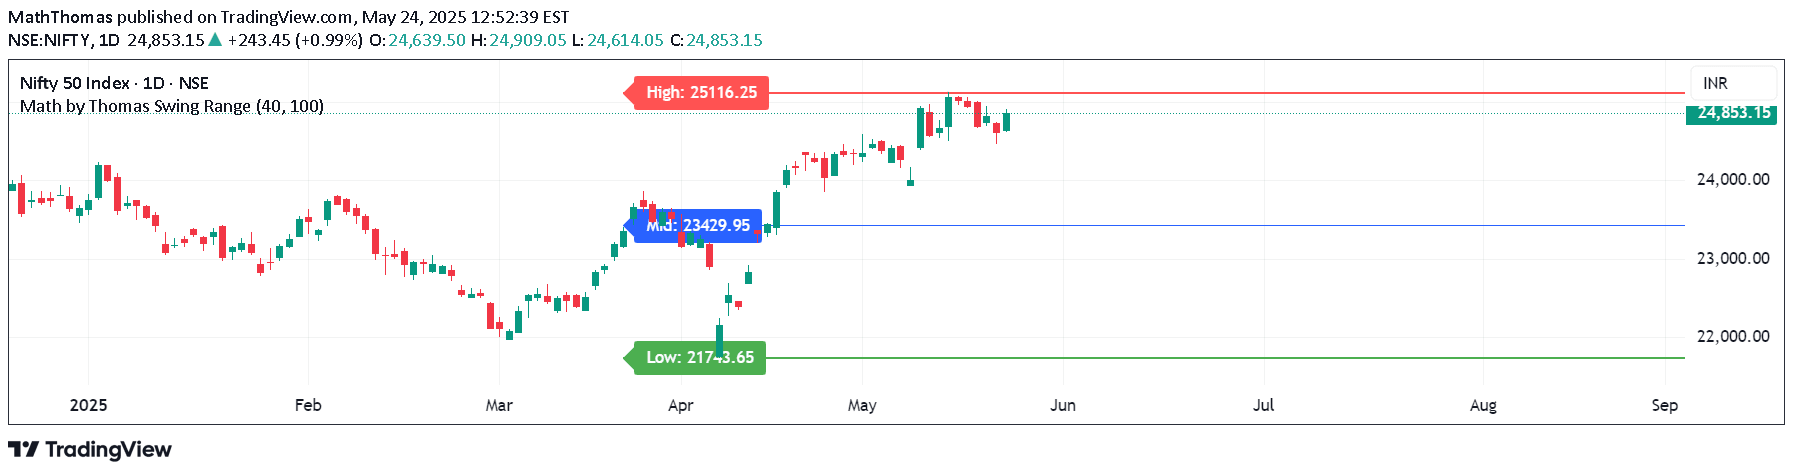
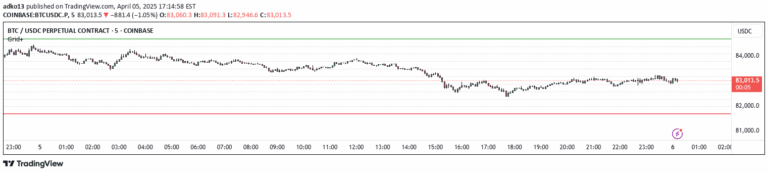
A weekly price level indicator that automatically calculates and plots key market levels, including highs, lows, midpoints, and extensions for comprehensive trading analysis.
Explore complementary indicator rolesHow it works
The script identifies the most recent completed weekly candle and dynamically calculates critical price levels. It automatically plots the weekly high and low points, creating a visual representation of key market boundaries.
Additionally, the indicator computes the midpoint at the 50% level and generates extension levels both above and below the primary price range. These levels are updated each week, providing traders with a continuously refreshed perspective on potential support and resistance zones.
Why it may be useful
Weekly levels provide traders with a strategic overview of market structure and potential price interaction points. By highlighting key weekly boundaries, traders can make more informed decisions about entry, exit, and risk management strategies.
The indicator's dynamic nature ensures that traders always have access to the most current market levels, helping them anticipate potential price movements and identify high-probability trading opportunities across different timeframes and market conditions.
When to explore it
This indicator is most effective during periods of market consolidation or when seeking to understand broader market context beyond intraday fluctuations. Traders can use these levels to identify potential reversal zones, breakout opportunities, and mean reversion setups.
It is particularly valuable for swing traders and day traders who want to align their shorter-term strategies with weekly market structure. The levels can help validate trade decisions, set stop-loss and take-profit targets, and provide a more comprehensive view of market dynamics.
Keep exploring
What we’ve verified
Access, alerts and repainting behaviour have not been independently verified for this indicator. Check the creator’s current publication and settings.
General descriptions and classifications are recovered research. Verified details above identify the specific checks we have completed. Check the creator’s current publication for later changes.