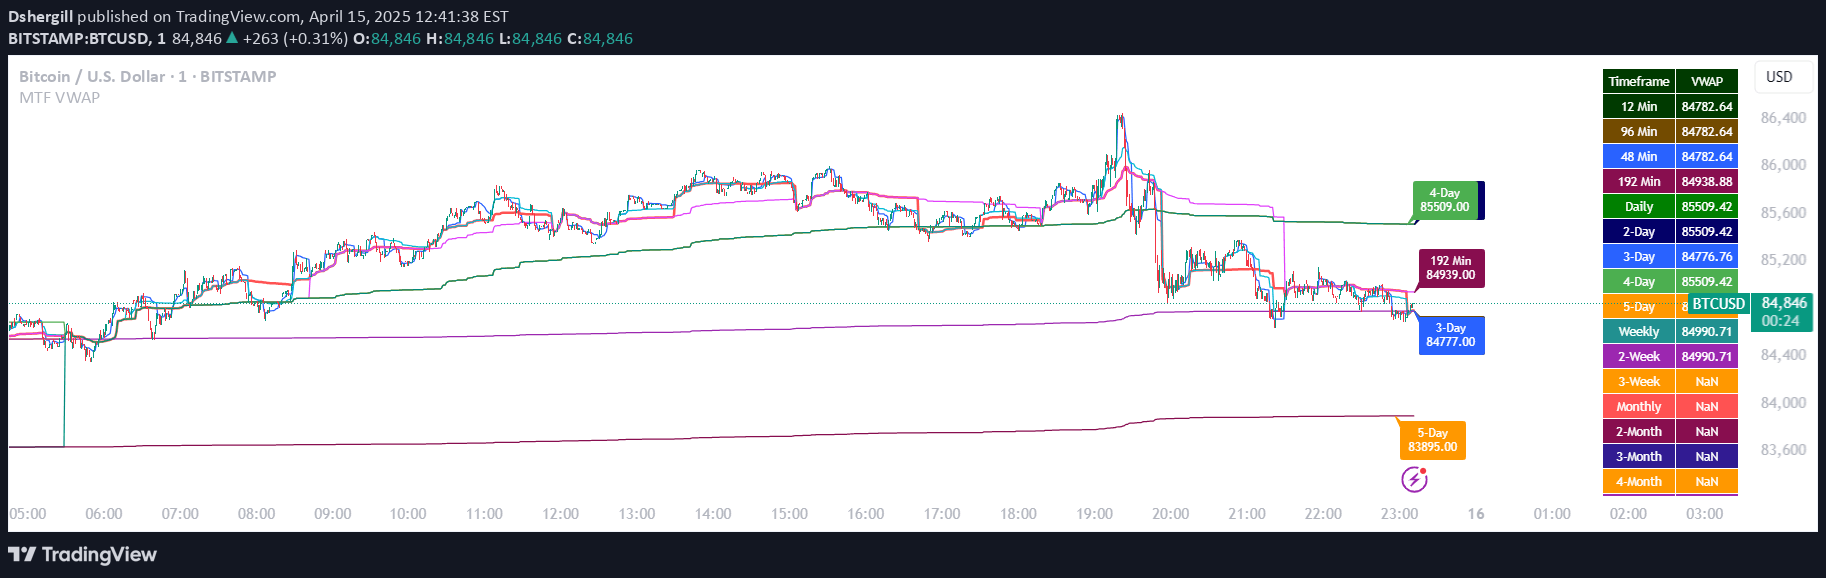
A customizable Volume Weighted Average Price (VWAP) indicator that allows traders to anchor from specific points, tracking institutional pricing zones and market dynamics.
Explore complementary indicator rolesHow it works
The Anchored VWAP works by calculating a volume-weighted average price from a specific user-defined starting point, unlike traditional daily or weekly VWAP resets. Traders select an anchor time such as a market open, key swing high/low, or significant news event, and the indicator calculates the average price weighted by trading volume from that precise moment.
The calculation considers both price and volume for each trading period, creating a dynamic line that reflects institutional trading levels and market sentiment. As new price and volume data emerge, the Anchored VWAP adjusts, providing traders with a real-time view of fair value and potential support/resistance zones.
Why it may be useful
The Anchored VWAP is crucial for traders seeking to understand institutional trading behavior and market dynamics beyond standard timeframe constraints. It offers a more flexible approach to tracking price equilibrium, allowing traders to focus on specific market events or significant price action moments.
By providing insights into institutional pricing zones, the indicator helps traders identify potential reversal points, gauge market sentiment, and make more informed trading decisions. It bridges the gap between technical analysis and institutional trading strategies, offering a sophisticated tool for understanding market microstructure.
When to explore it
The Anchored VWAP is most effective during intraday trading, particularly when tracking breakouts, identifying mean reversion zones, or analyzing market reactions to key events. Traders can use it to anchor from significant price points like swing highs/lows, market opens, or during critical market events such as earnings announcements or policy releases.
It's particularly valuable for traders using Smart Money Concepts (SMC), fair value gaps, and order block analysis. The indicator works across multiple timeframes, from 1-minute charts to daily charts, making it versatile for different trading styles and market conditions.
Keep exploring
What we’ve verified
Access, alerts and repainting behaviour have not been independently verified for this indicator. Check the creator’s current publication and settings.
General descriptions and classifications are recovered research. Verified details above identify the specific checks we have completed. Check the creator’s current publication for later changes.