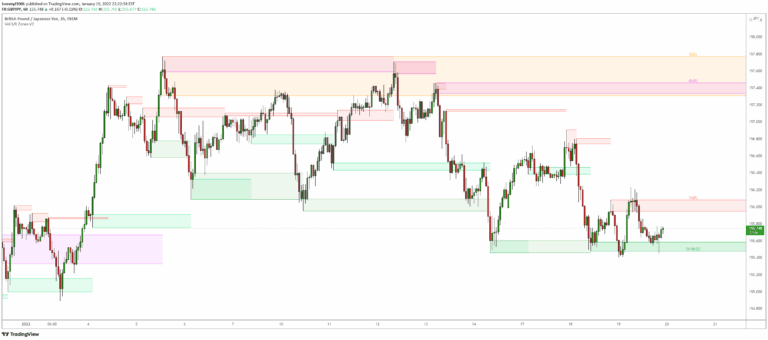
Volume-based Support & Resistance Zones
An advanced Support & Resistance indicator that identifies significant price zones using volume and fractal highs/lows, helping traders visualize potential trend reversals and continuations.
Explore 11,183 indicators. Filter beyond the obvious.
Discover the tools that fit the way you trade.
11,183 tools to explore
An advanced Support & Resistance indicator that identifies significant price zones using volume and fractal highs/lows, helping traders visualize potential trend reversals and continuations.
A liquidity indicator that highlights swing areas with trading activity, tracking price revisits, accumulated volume, and potential support/resistance zones using customizable filtering.
CM MACD Ultimate Multi-Timeframe V2 is an advanced MACD indicator with enhanced customization options, multi-timeframe analysis, and comprehensive trend visualization features.
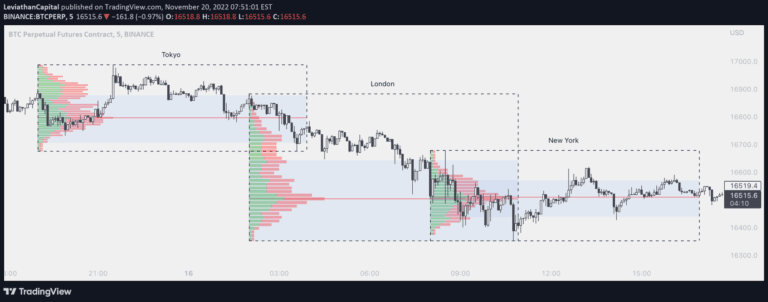
A comprehensive forex market session tracker with Volume Profile analysis that allows traders to visualize trading activity across different global market sessions and timeframes.
A customizable market session tracker displaying trading hours for Tokyo, London, New York, and Sydney with multiple visualization options and advanced trading insights.
An advanced script that identifies and visualizes pivot points, helping traders recognize market structure, potential support/resistance levels, and trading opportunities through customizable swing high and low indicators.
A customizable moving average indicator that combines trend analysis with mean reversion detection, offering dynamic candle coloring and an oscillator to identify potential price shifts.
An advanced N-bar reversal pattern detector that identifies potential trend reversals by analyzing multiple consecutive candles and their price action, with customizable filtering options.
An advanced Open Interest indicator that provides comprehensive market insights through multiple visualization techniques and real-time statistical analysis of trading positions.
An advanced Ichimoku Kinko Hyo indicator with extensive customization options for analyzing market trends, momentum, and potential trading signals across different timeframes.
A multi-timeframe candle visualization script that provides advanced trading insights, including volume information, remaining candle time, and breakout detection with customizable display options.
An advanced trading tool that analyzes price ranges by automatically drawing range levels, volume profiles, and various analytical tools to help traders understand market structure and potential price movements.
Likes, views, and comments are historical TradingView snapshots. They describe attention, not trading performance.