
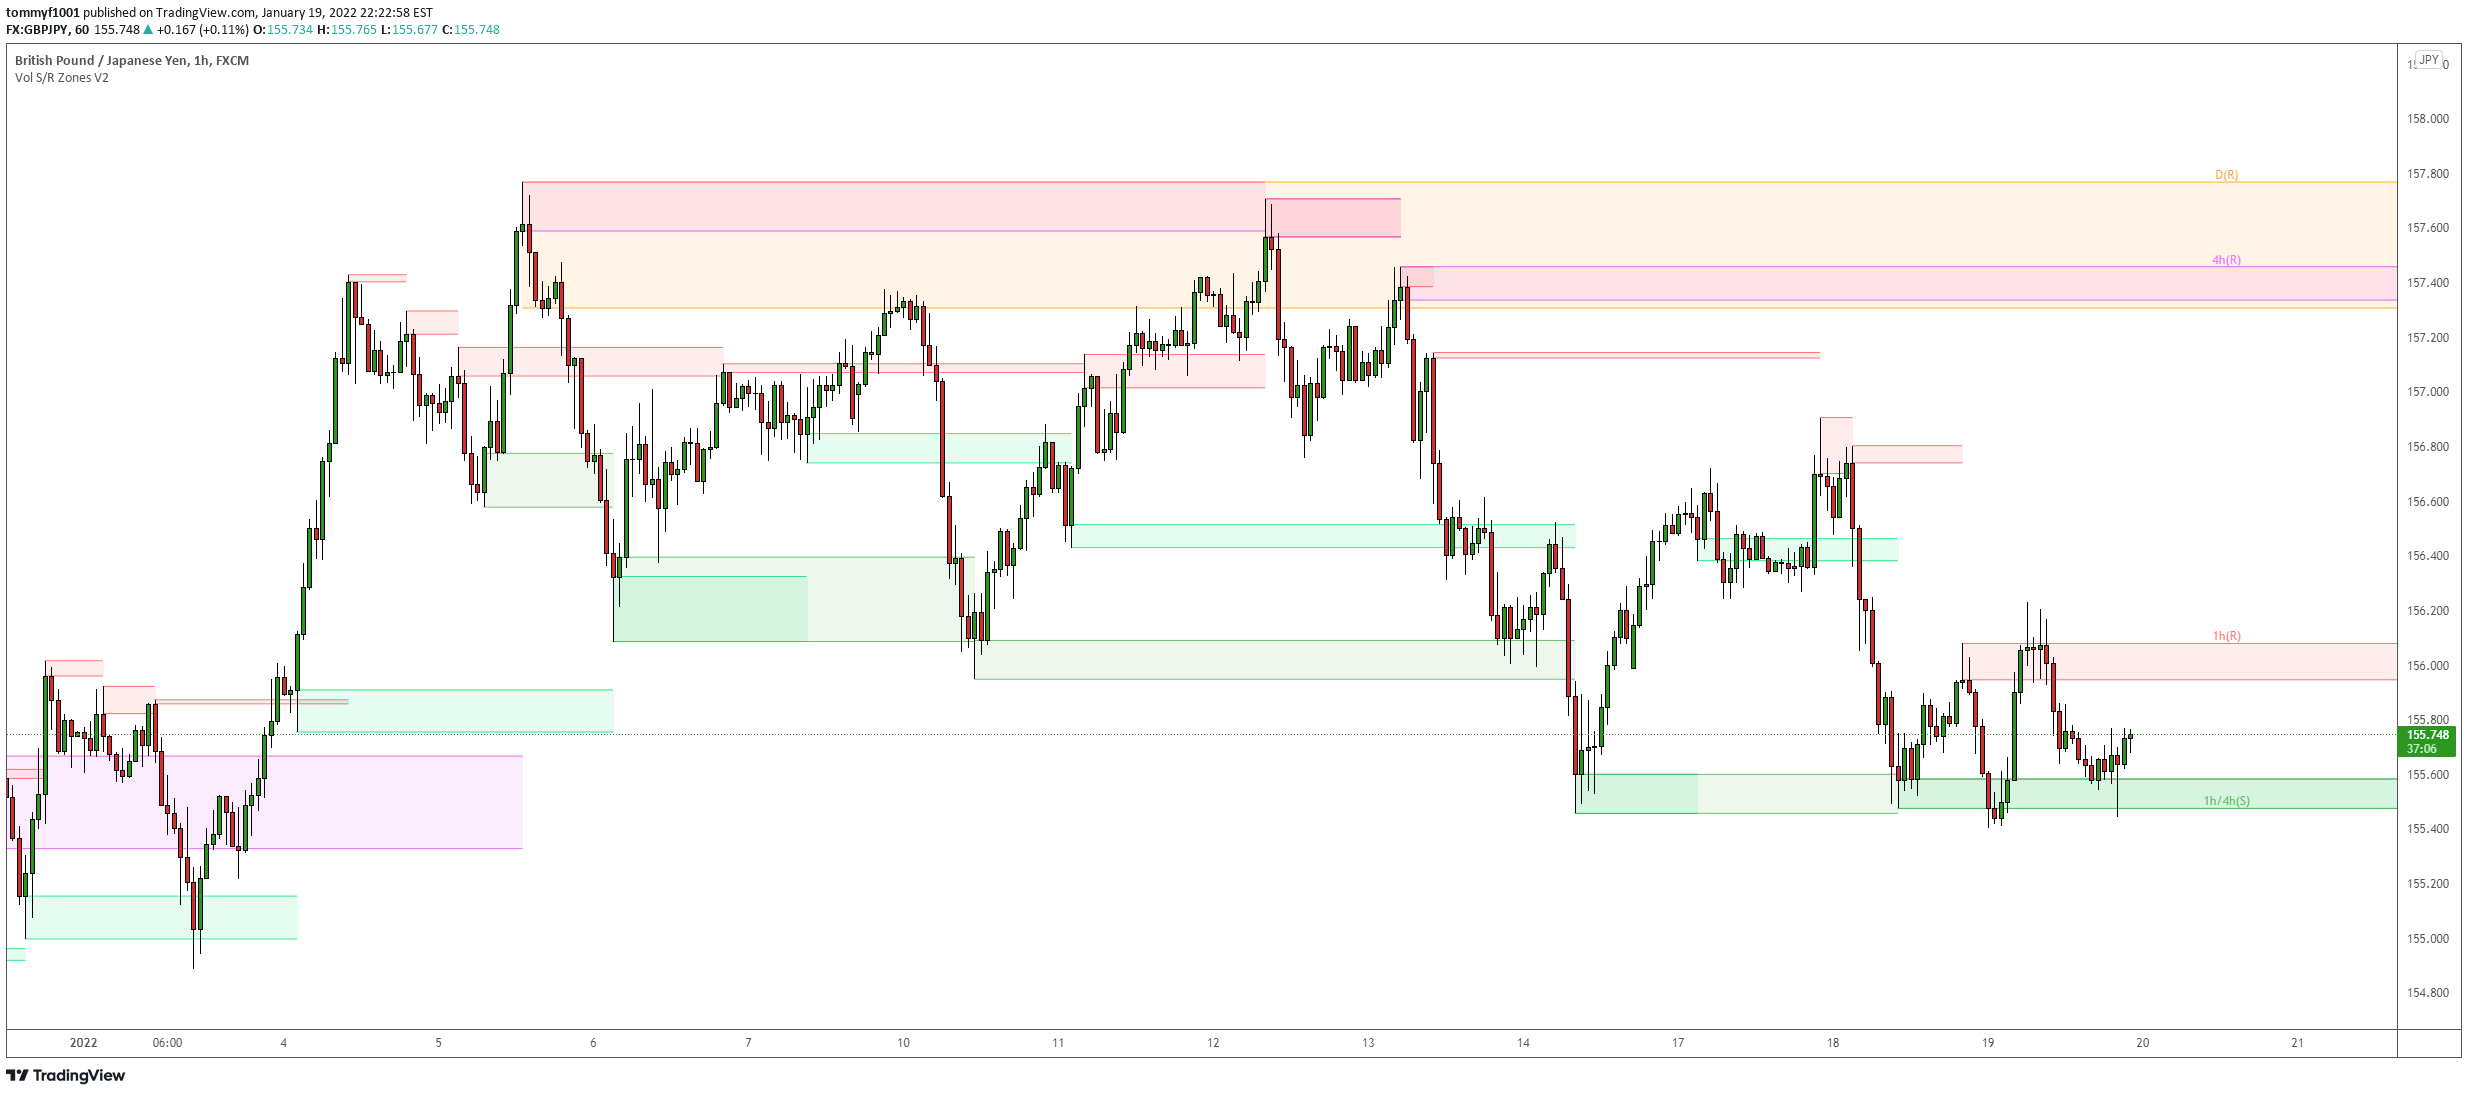
An advanced Support & Resistance indicator that identifies significant price zones using volume and fractal highs/lows, helping traders visualize potential trend reversals and continuations.
Explore complementary indicator rolesHow it works
The indicator identifies Support and Resistance zones by analyzing fractal highs and lows with volume that exceeds a moving average. It confirms fractal points by requiring three successive higher highs followed by two lower highs, or vice versa for lows.
The zone is created between the fractal point and the candle's close, with larger zones indicating more significant price levels. Users can customize the indicator's settings, including time frames, volume moving average, and display options
Why it may be useful
This indicator helps traders understand critical price levels where trends might reverse or continue. By visualizing Support and Resistance zones based on volume and fractal patterns, traders can make more informed decisions about potential entry and exit points.
The customizable nature of the indicator allows traders to adapt it to different trading styles and market conditions, providing a flexible tool for technical analysis
When to explore it
The indicator works best in trending markets with clear price movements and significant volume. It is particularly useful for swing traders and day traders who want to identify key support and resistance levels.
Traders should use this indicator in conjunction with other technical analysis tools to confirm signals. It is most effective on liquid markets with consistent volume and when price is showing clear directional movement
Keep exploring
What we’ve verified
Access, alerts and repainting behaviour have not been independently verified for this indicator. Check the creator’s current publication and settings.
General descriptions and classifications are recovered research. Verified details above identify the specific checks we have completed. Check the creator’s current publication for later changes.



