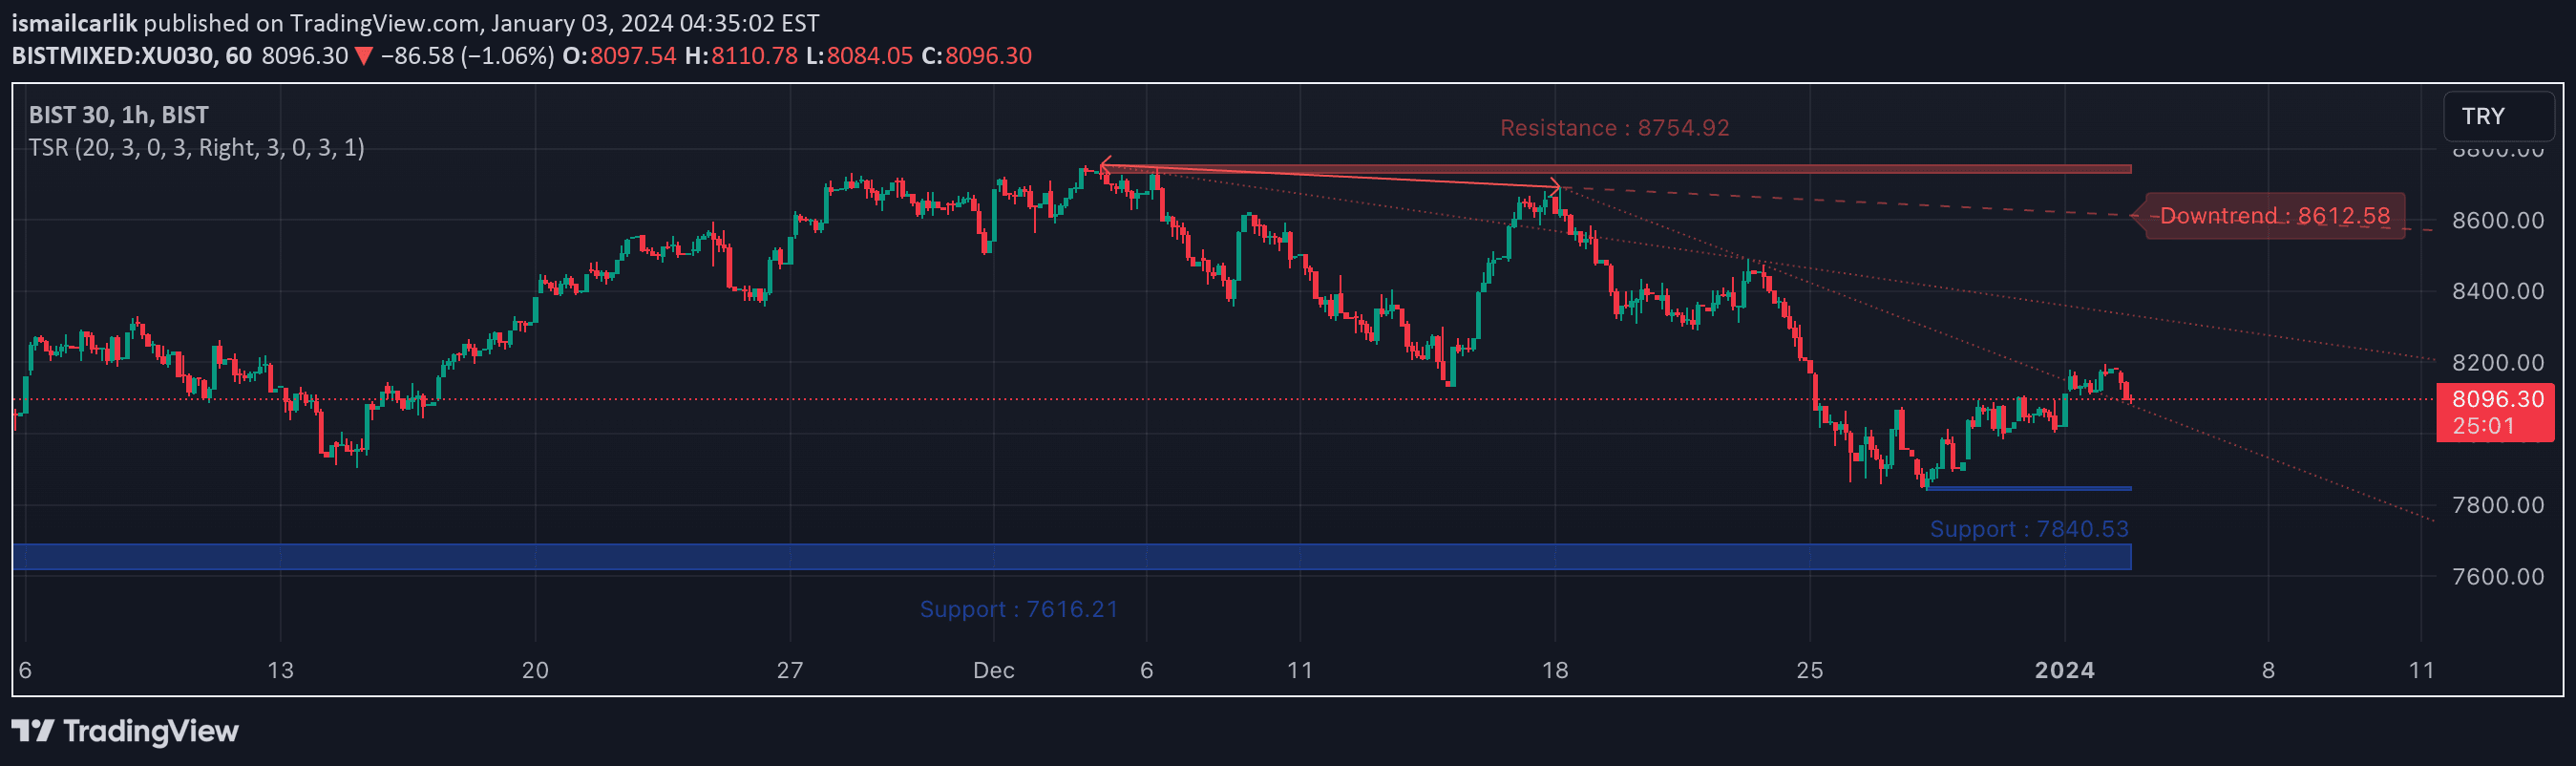
An advanced support and resistance indicator that identifies key price levels using pivot points, volume, and strength metrics to help traders recognize potential market reversals and consolidation zones.
Explore complementary indicator rolesHow it works
The indicator detects pivot points by analyzing price action and trend confirmation through short and long-term moving averages. It requires a specified number of bars on either side with no higher highs or lower lows, ensuring only significant price levels are identified.
Once pivots are detected, the system tracks and ranks support and resistance levels based on their recency, volume, and number of touches. It dynamically manages these levels by merging nearby levels, updating prices with strength-weighted averages, and pruning weaker or older levels to maintain relevance and accuracy.
Why it may be useful
Support and resistance levels are crucial for understanding market psychology and potential price reversal zones. This indicator goes beyond traditional methods by incorporating sophisticated calculations that consider volume, trend confirmation, and level strength, providing traders with a more nuanced view of market dynamics.
By offering visual representations of key levels through lines, zones, and labels, the indicator helps traders identify potential entry and exit points with greater precision. The ability to customize settings allows traders to adapt the tool to different market conditions and trading styles.
When to explore it
This indicator is most effective in markets with clear trending or ranging behavior, where price repeatedly tests and respects certain levels. It works particularly well in timeframes that allow for sufficient pivot point detection, such as daily, 4-hour, and 1-hour charts.
Traders should use this tool in conjunction with other technical analysis methods to confirm signals and reduce false positives. It is especially useful during periods of market consolidation, breakouts, and when looking to identify potential support and resistance zones for trade management.
Keep exploring
What we’ve verified
Access, alerts and repainting behaviour have not been independently verified for this indicator. Check the creator’s current publication and settings.
General descriptions and classifications are recovered research. Verified details above identify the specific checks we have completed. Check the creator’s current publication for later changes.