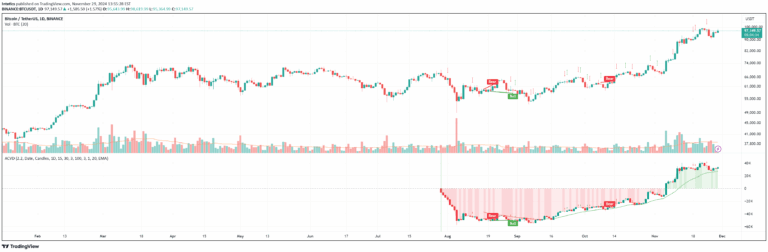
An advanced volume delta indicator that tracks cumulative buying and selling pressure using color-coded candles and moving averages to analyze market dynamics and potential trend reversals.
Explore complementary indicator rolesHow it works
The Enhanced Cumulative Volume Delta (CVD) indicator calculates the delta between buying and selling volume by tracking price movements and associated trading volume. It generates color-coded candles where teal represents positive buying pressure and soft red indicates selling pressure, providing a visual representation of market sentiment.
The indicator incorporates three customizable moving averages that can be configured as Simple Moving Averages (SMA) or Exponential Moving Averages (EMA). These moving averages help smooth the volume data and provide different perspectives on short-term, medium-term, and long-term volume trends, allowing traders to analyze volume dynamics across multiple timeframes.
Why it may be useful
Volume analysis is crucial for understanding market sentiment and potential price movements, as it reveals the underlying strength or weakness of a trend. By tracking the cumulative volume delta, traders can gain deeper insights into whether buying or selling pressure is dominating the market, which can help predict potential trend continuations or reversals.
The indicator's ability to display arrow markers when volume crosses specific moving averages provides traders with clear visual signals that can help identify potential entry and exit points. Moreover, the customizable nature of the moving averages allows traders to adapt the indicator to their specific trading style and timeframe preferences.
When to explore it
The Enhanced CVD indicator is most effective during periods of significant market activity, such as during trending markets or when anticipating potential trend reversals. Traders can use this tool to confirm existing trends by observing the consistency of volume delta and moving average alignments, which can provide additional confirmation beyond price action alone.
The indicator is particularly useful in volatile markets where volume can provide critical insights into market sentiment. Traders should pay special attention to divergences between price movement and volume delta, as these can signal potential weakness in the current trend or hint at an upcoming trend reversal.
Keep exploring
What we’ve verified
Access, alerts and repainting behaviour have not been independently verified for this indicator. Check the creator’s current publication and settings.
General descriptions and classifications are recovered research. Verified details above identify the specific checks we have completed. Check the creator’s current publication for later changes.