
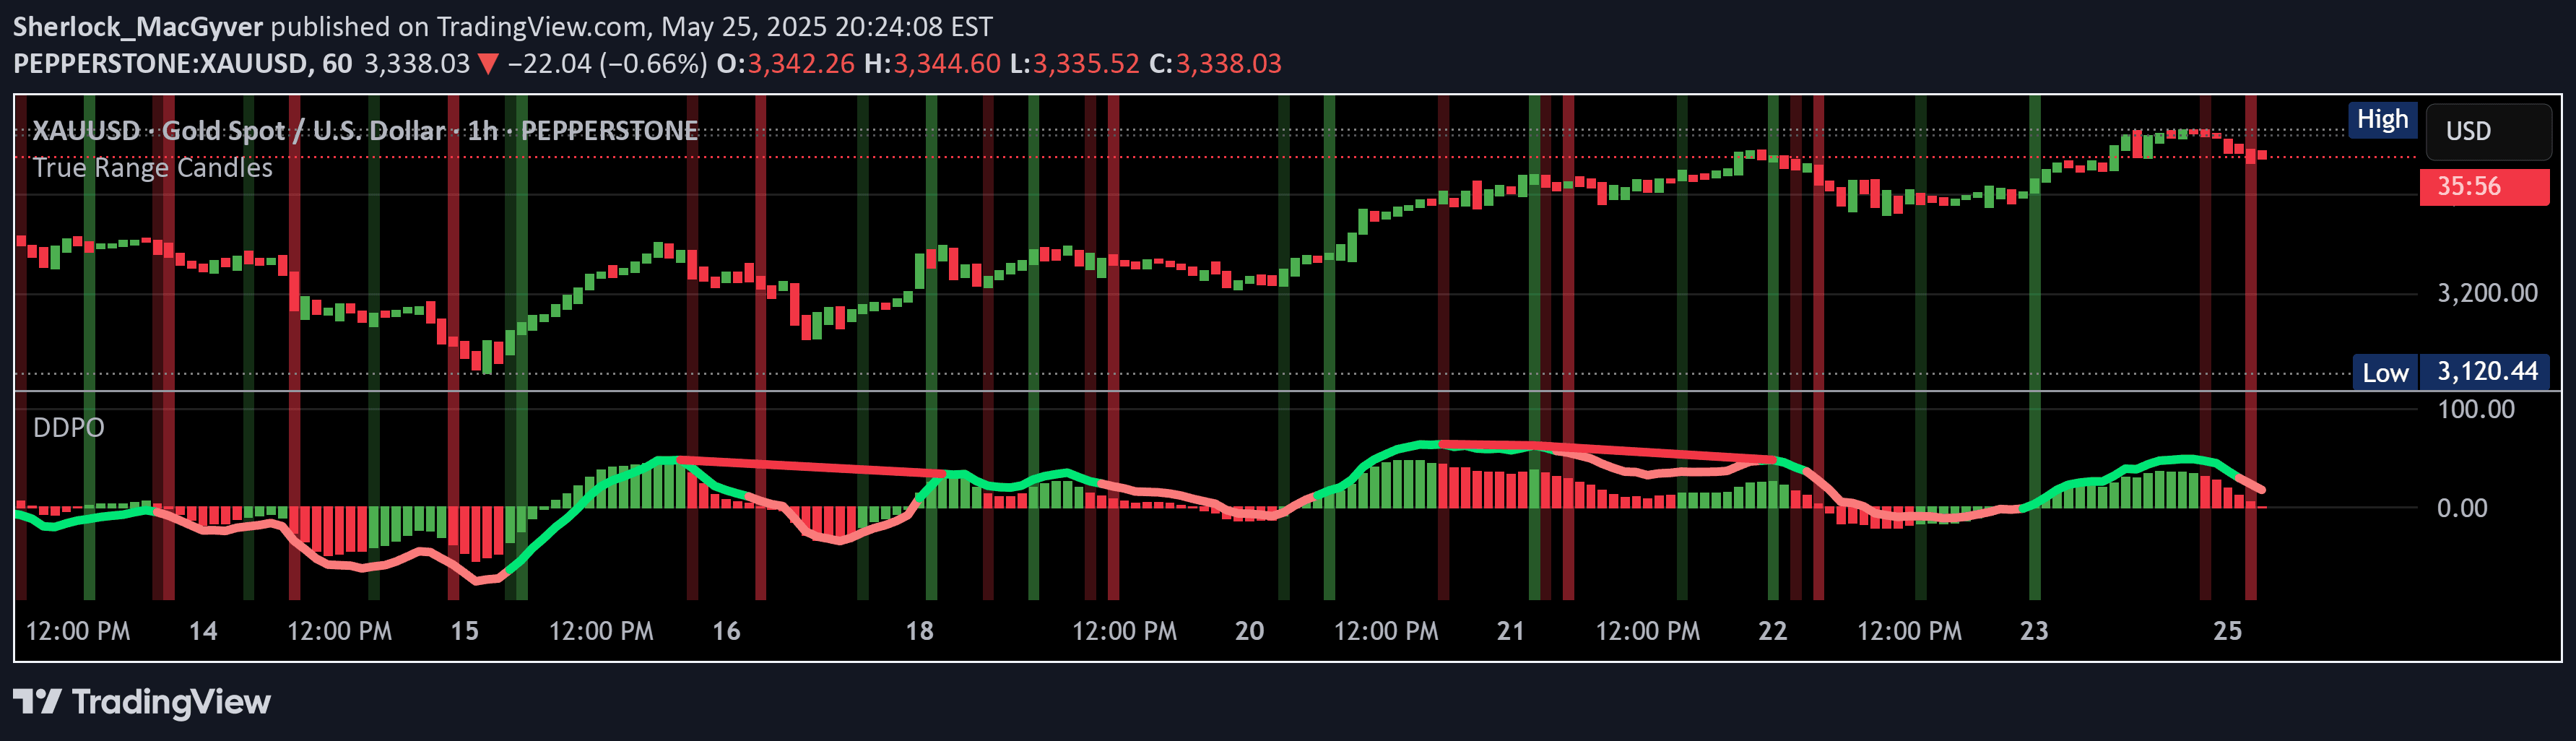
A technical analysis tool that identifies market trends and potential trend changes by averaging Detrended Price Oscillator calculations across multiple periods with customizable smoothing.
Explore complementary indicator rolesHow it works
The Dope DPO indicator calculates trend direction by averaging Detrended Price Oscillator values across ten different time periods. It applies user-selected smoothing techniques like SMA, EMA, WMA, or RMA to reduce price volatility and provide a more comprehensive market view.
By comparing the current smoothed DPO value to its previous value, the indicator detects potential trend changes and momentum shifts. The calculation involves tracking price movements relative to a moving average, which helps identify when prices deviate from their typical trend patterns.
Why it may be useful
The Dope DPO offers traders a nuanced approach to understanding market dynamics by providing a multi-period trend analysis tool. Its ability to smooth price fluctuations helps reduce false signals and gives traders a more reliable view of underlying market movements.
By incorporating color-coded visual representations and customizable parameters, the indicator makes complex trend analysis more accessible. Traders can quickly interpret market sentiment through green and red color indicators, which represent bullish and bearish momentum respectively.
When to explore it
The Dope DPO is most effective in markets with clear trending behavior, where price movements show consistent directional momentum. It works particularly well in markets with moderate volatility, where trend changes are more predictable and less erratic.
Traders should use this indicator in conjunction with other technical analysis tools to confirm signals and reduce the risk of false positives. It is especially useful for identifying potential entry and exit points during trend reversals or when momentum appears to be shifting.
Keep exploring
What we’ve verified
Access, alerts and repainting behaviour have not been independently verified for this indicator. Check the creator’s current publication and settings.
General descriptions and classifications are recovered research. Verified details above identify the specific checks we have completed. Check the creator’s current publication for later changes.


