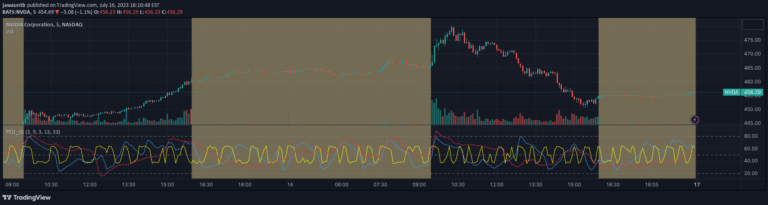
A customized RSI indicator with dual Bollinger Bands that helps traders identify momentum shifts, potential divergences, and market conditions through visual zones and band interactions.
Explore complementary indicator rolesHow it works
This indicator combines RSI with Bollinger Bands to create a multi-layered momentum analysis tool. It uses two sets of Bollinger Bands with different standard deviations, allowing traders to visualize potential price movements and momentum shifts through band interactions and crossovers.
The white RSI line is tracked against the bands, with specific entry signals generated when the line crosses into the bands and then moves over the yellow moving average. Custom settings enable traders to adjust moving averages for both RSI calculation and Bollinger Bands, providing flexibility in analyzing different market conditions.
Why it may be useful
The indicator offers traders a comprehensive view of market momentum and potential trend reversals by integrating multiple technical analysis tools into a single visual representation. Its color-coded zones and multiple band layers help traders quickly identify market states, from momentum trends to stagnant periods.
By highlighting areas of potential price rejection and momentum changes, this tool provides traders with nuanced insights that go beyond traditional single-indicator analysis. The ability to customize settings makes it adaptable to various trading styles and market environments.
When to explore it
This indicator is most effective in markets with clear momentum trends and when traders want to identify potential entry and exit points based on RSI and Bollinger Band interactions. It works particularly well in identifying short-term momentum shifts and potential trend reversals across different timeframes.
Traders should use this indicator in conjunction with other technical analysis tools, especially when seeking to confirm trend strength, detect divergences, and understand market psychology. It is particularly useful in volatile markets where momentum can change rapidly and traders need a multi-dimensional view of price action.
Keep exploring
What we’ve verified
Access, alerts and repainting behaviour have not been independently verified for this indicator. Check the creator’s current publication and settings.
General descriptions and classifications are recovered research. Verified details above identify the specific checks we have completed. Check the creator’s current publication for later changes.