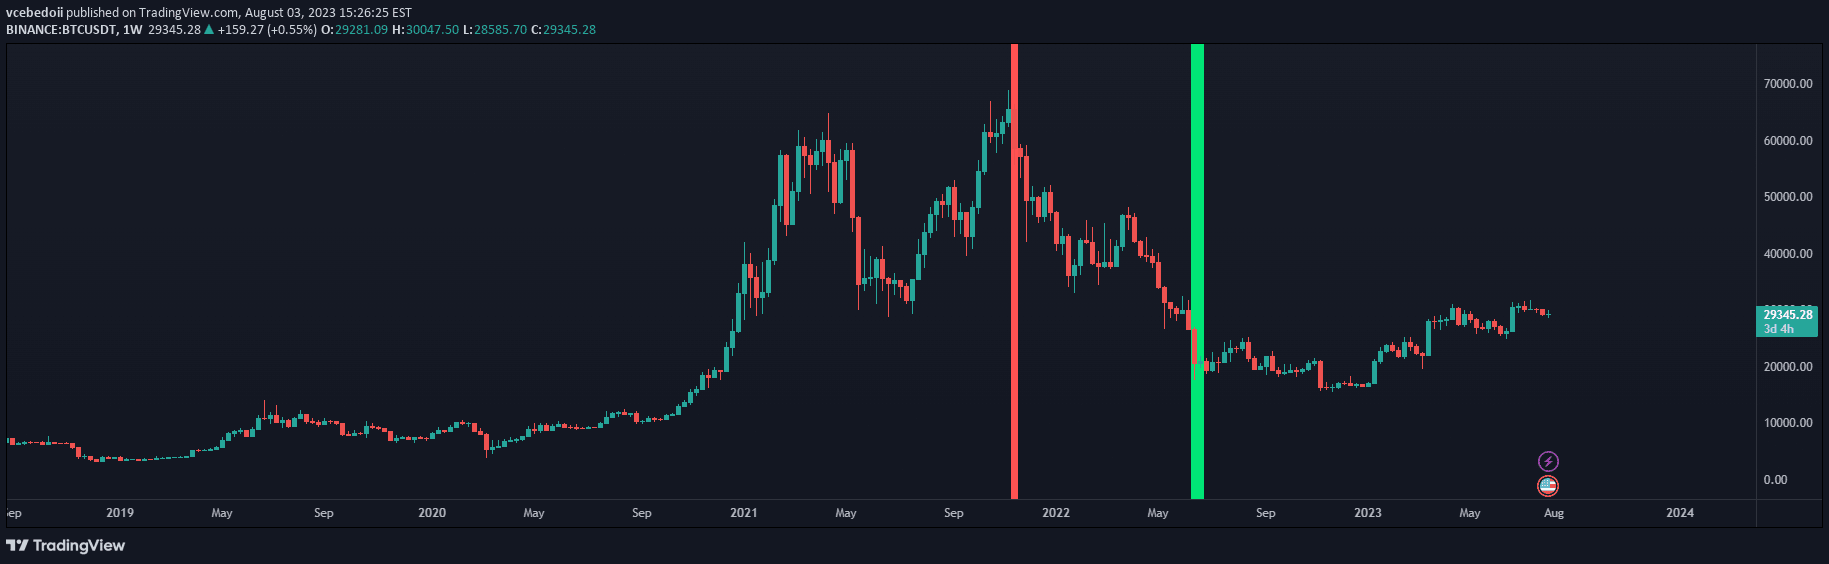
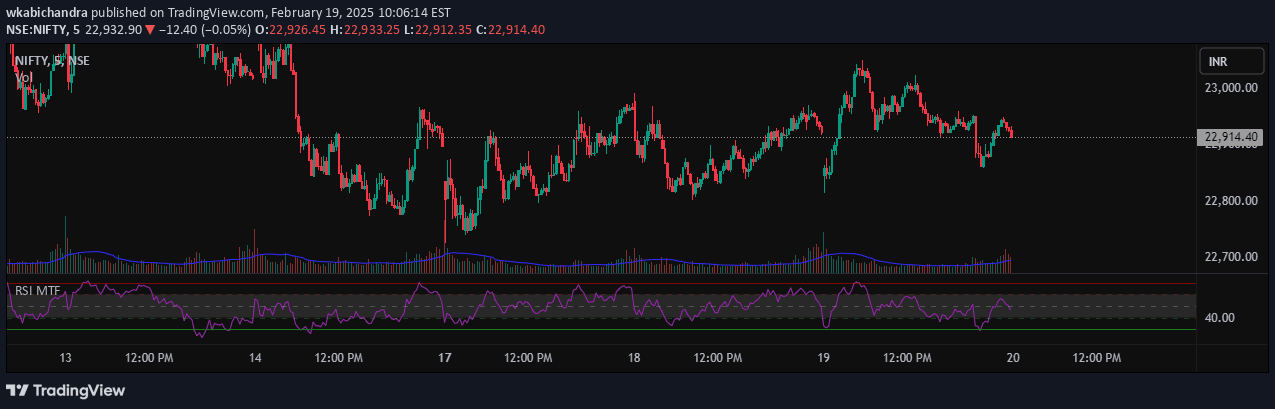
A comprehensive trading signal combining RSI, SMA, and Bollinger Bands to analyze market trends, momentum, and potential price movements using multiple technical indicators.
Explore complementary indicator rolesHow it works
The signal integrates Relative Strength Index (RSI), Simple Moving Average (SMA), and Bollinger Bands to provide a multi-layered analysis of market conditions. The RSI is calculated using a 14-period timeframe applied to price close, which helps measure momentum and potential overbought or oversold conditions. The SMA with a 26-period provides trend direction and smooths out price fluctuations.
The Bollinger Bands, set with a 50-period and standard deviation of 2, create dynamic price channels that adapt to market volatility. By using the RSI as the source for both SMA and Bollinger Bands, traders can gain insights into trend strength, potential reversals, and price volatility in a unified analytical approach.
Why it may be useful
This comprehensive signal offers traders a sophisticated method to understand market dynamics by combining multiple technical indicators into a single, powerful analysis tool. By integrating RSI, SMA, and Bollinger Bands, traders can simultaneously assess momentum, trend direction, and price volatility, which provides a more holistic view of potential market movements.
The multi-indicator approach reduces the likelihood of false signals and increases the probability of making informed trading decisions. Traders can leverage these combined insights to identify potential entry and exit points, understand market sentiment, and develop more robust trading strategies across different market conditions and timeframes.
When to explore it
This signal is most effective in markets with clear trend characteristics and moderate to high volatility, such as forex, stocks, and cryptocurrency markets. It works best when price movements show consistent patterns and when traders want to capture both short-term momentum and longer-term trend developments. The combination of indicators allows for more nuanced analysis compared to single-indicator approaches.
Traders should apply this signal during periods of stable market conditions and avoid using it during extreme market events or significant news-driven volatility. It is particularly useful for traders who prefer a comprehensive, data-driven approach to market analysis and want to minimize emotional decision-making by relying on multiple technical indicators.
Keep exploring
What we’ve verified
Access, alerts and repainting behaviour have not been independently verified for this indicator. Check the creator’s current publication and settings.
General descriptions and classifications are recovered research. Verified details above identify the specific checks we have completed. Check the creator’s current publication for later changes.