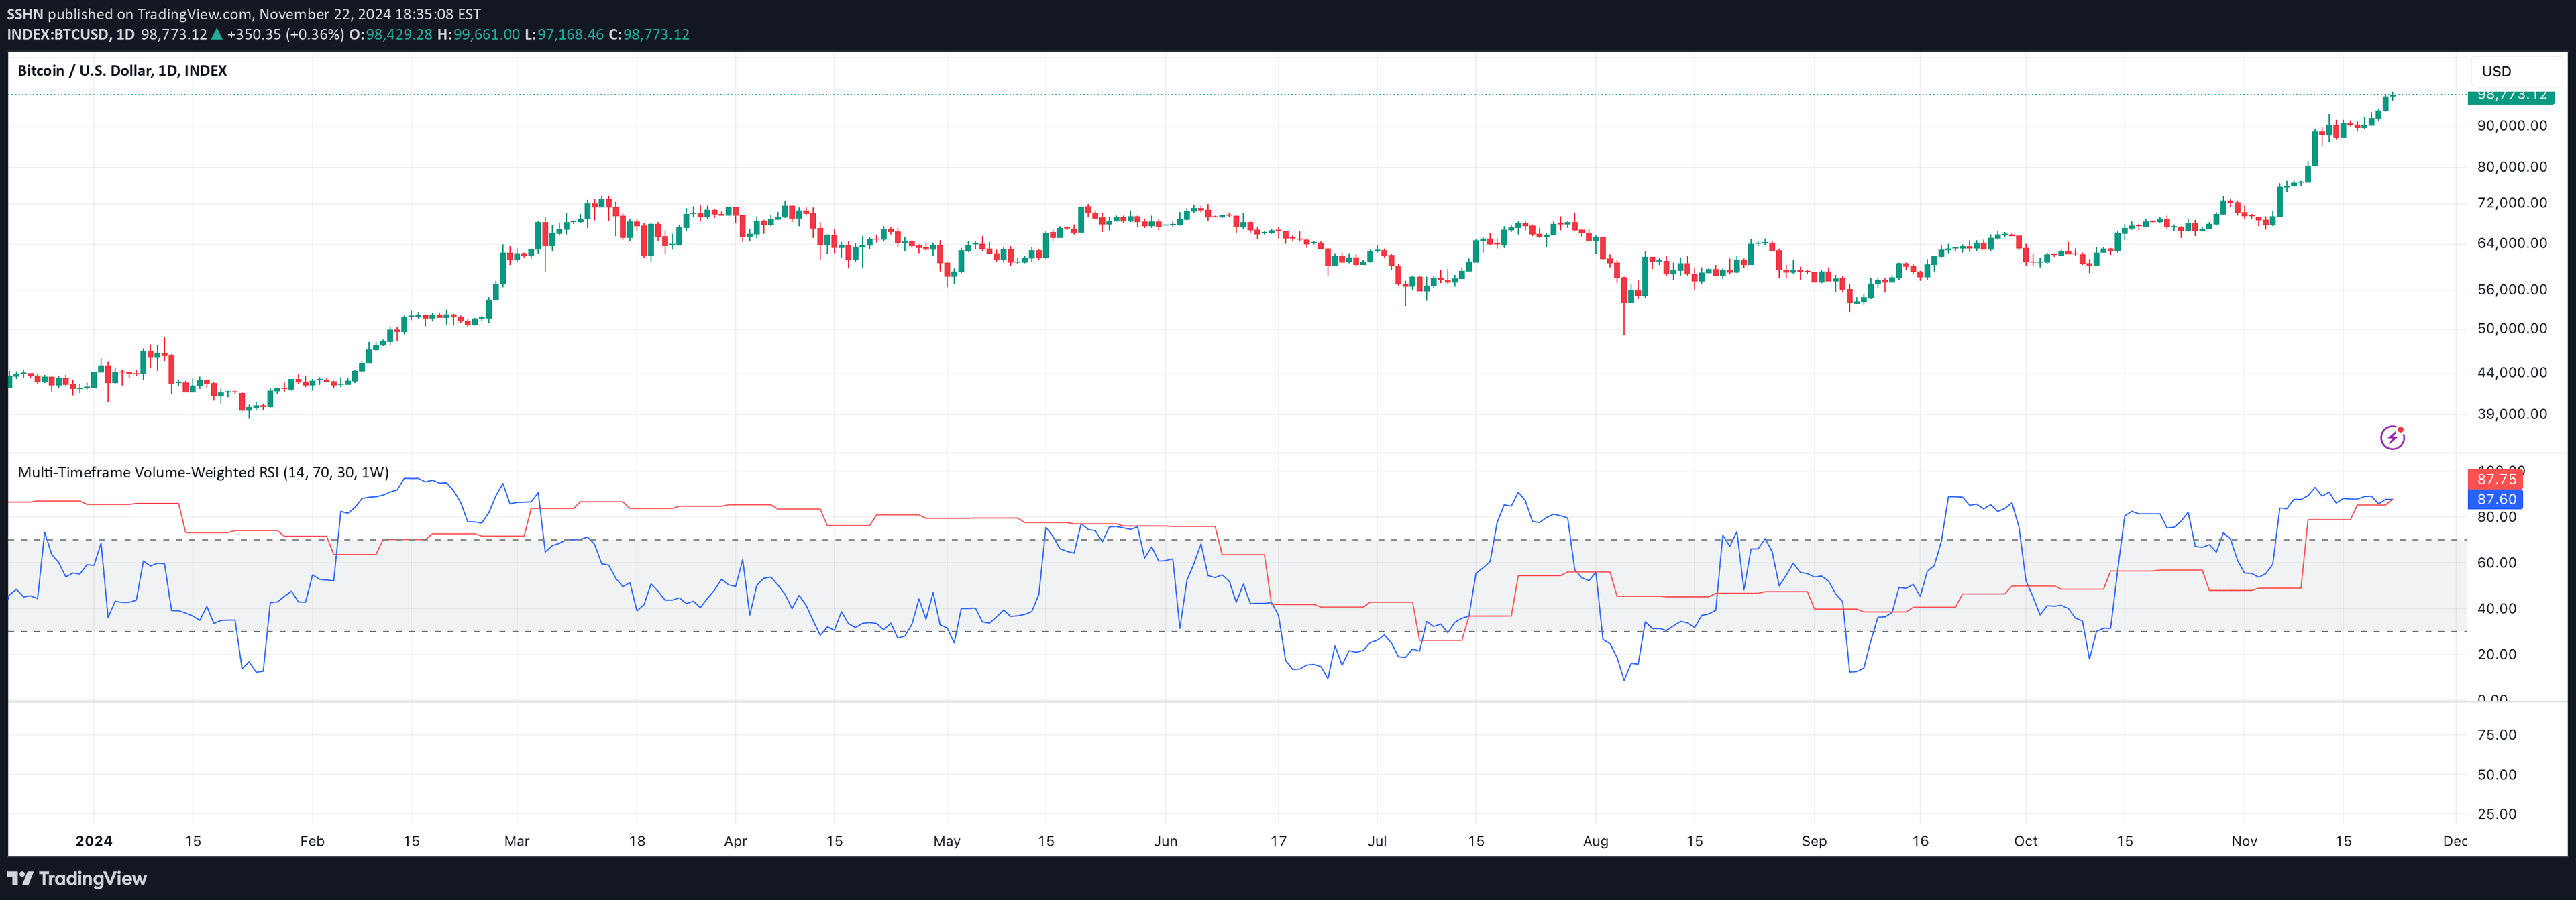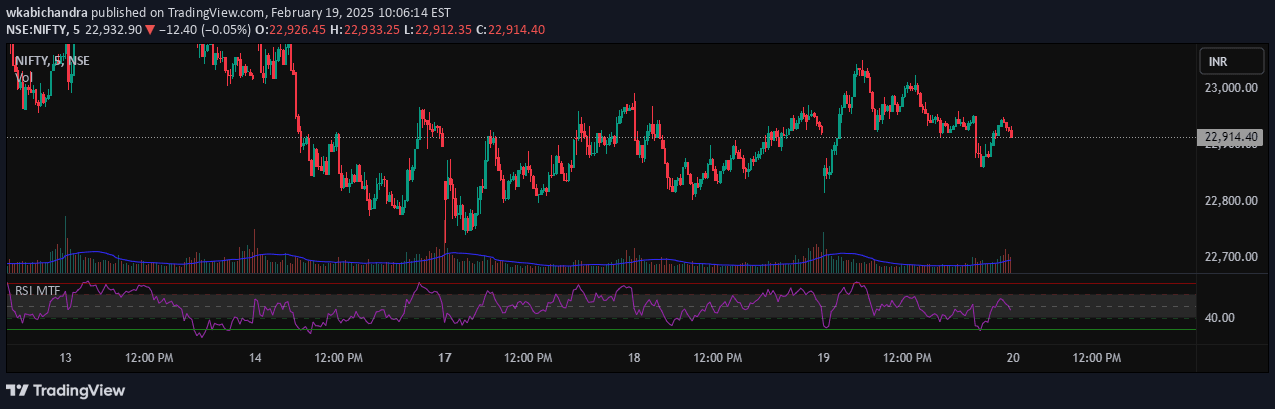
A multi-timeframe RSI indicator that provides momentum insights across 1, 5, 15, and 30-minute charts, helping traders identify trend shifts and overbought/oversold conditions quickly.
Explore complementary indicator rolesHow it works
The Multi-Timeframe RSI Indicator calculates the Relative Strength Index simultaneously across four different short-term timeframes: 1, 5, 15, and 30 minutes. It measures price momentum by comparing upward and downward price movements within each timeframe, generating numerical values between 0 and 100.
When the RSI crosses above 70, it suggests overbought conditions, while readings below 30 indicate oversold conditions. By displaying these values across multiple timeframes, traders can quickly assess momentum consistency and potential trend reversals, providing a more comprehensive view of market dynamics.
Why it may be useful
The Multi-Timeframe RSI Indicator offers traders a powerful tool for understanding market momentum across different short-term perspectives. By providing simultaneous RSI readings, it helps traders confirm trend strength, identify potential entry and exit points, and reduce the risk of making decisions based on limited timeframe information.
This approach allows traders to align their strategies with more robust momentum signals, potentially improving trade precision and reducing false signals that might occur when analyzing a single timeframe. The indicator's flexibility and multi-perspective approach make it particularly valuable for intraday and scalping strategies.
When to explore it
The Multi-Timeframe RSI Indicator is most effective during periods of active market movement, particularly in volatile or trending markets. Traders should focus on using this tool during high-liquidity trading sessions, such as during major market hours when price movements are more pronounced and meaningful.
It works best when combined with other technical analysis tools and when traders can quickly interpret momentum signals across different timeframes. Ideal scenarios include identifying potential trend reversals, confirming breakout opportunities, and making quick, informed decisions in fast-moving market conditions.
Keep exploring
What we’ve verified
Access, alerts and repainting behaviour have not been independently verified for this indicator. Check the creator’s current publication and settings.
General descriptions and classifications are recovered research. Verified details above identify the specific checks we have completed. Check the creator’s current publication for later changes.