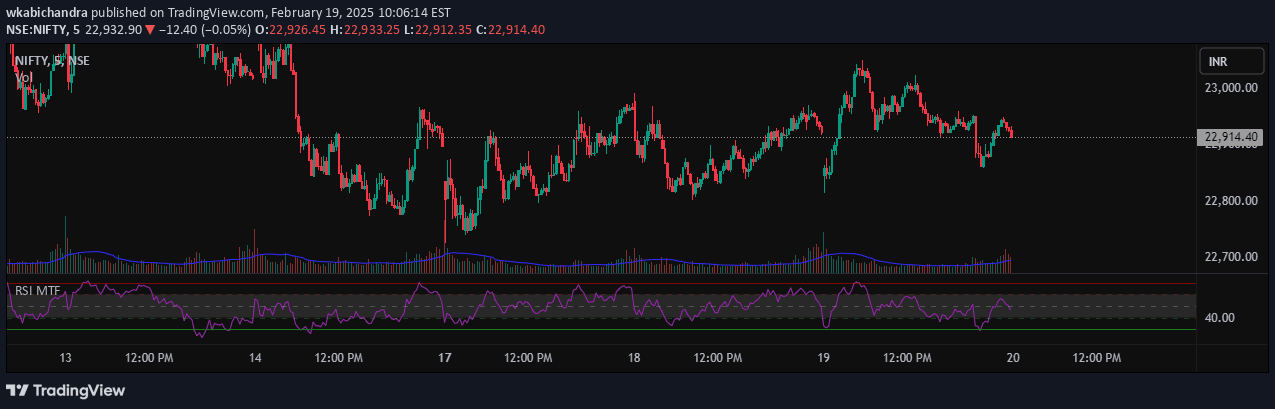
Multi-timeframe RSI tool analyzing Relative Strength Index across five different timeframes, providing color-coded visual signals for potential market reversals and trend strength.
Explore complementary indicator rolesHow it works
The RSI Multi-Timeframe Table calculates the Relative Strength Index across multiple timeframes including 15m, 1h, 4h, 1d, and 1w. It uses a default 14-period RSI calculation that measures the magnitude of recent price changes to evaluate overbought or oversold conditions.
The indicator generates a color-coded table with visual signals: red for overbought zones (above 70), blue for oversold zones (below 30), and yellow for neutral areas. Background shading on the main chart and horizontal reference lines at 30 and 70 levels help traders quickly interpret market momentum and potential trend reversals.
Why it may be useful
The RSI Multi-Timeframe Table provides traders with a comprehensive view of market momentum across different time horizons, enabling more informed trading decisions. By comparing RSI values simultaneously, traders can identify potential divergences and trend strengths that might not be apparent on a single timeframe.
The color-coded system simplifies complex technical analysis, allowing traders to quickly assess market conditions without extensive manual calculations. This visual approach helps traders recognize potential entry and exit points, understand market sentiment, and develop more nuanced trading strategies.
When to explore it
The RSI Multi-Timeframe Table is most effective during trending and ranging markets where momentum signals can provide valuable insights. Traders can use this tool to confirm trend strength, identify potential reversals, and assess market sentiment across multiple timeframes.
It is particularly useful when comparing RSI values between different time periods, such as when the short-term RSI shows overbought conditions while longer-term RSI remains neutral or bullish. Traders should always combine these signals with other technical indicators and fundamental analysis to validate potential trading opportunities.
Keep exploring
What we’ve verified
Access, alerts and repainting behaviour have not been independently verified for this indicator. Check the creator’s current publication and settings.
General descriptions and classifications are recovered research. Verified details above identify the specific checks we have completed. Check the creator’s current publication for later changes.