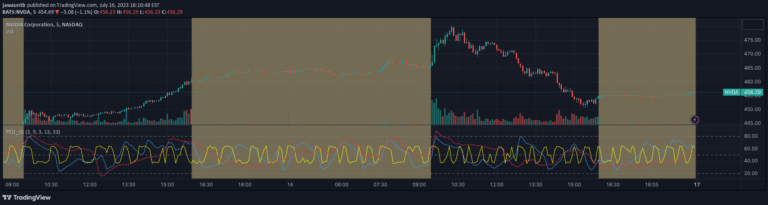
A momentum oscillator that combines price rate of change with volatility, measuring trend strength through a histogram that signals market directional moves and potential breakouts.
Explore complementary indicator rolesHow it works
The VAMO indicator calculates momentum by using the Rate of Change (ROC) to measure price velocity, then multiplies this by the Average True Range (ATR) to incorporate volatility. This multiplication creates a weighted momentum value that reflects both price movement speed and market volatility intensity.
The resulting value is plotted as a color-coded histogram oscillating around zero, with green bars above zero indicating bullish momentum and red bars below zero signaling bearish momentum. The size and color of the bars provide visual insight into the strength and direction of the current market trend.
Why it may be useful
By integrating momentum and volatility, the VAMO helps traders identify potentially significant market moves that might be overlooked by traditional single-dimension indicators. It provides a more nuanced view of market dynamics, highlighting moments when price changes are accompanied by meaningful volatility.
The indicator's adaptive nature makes it particularly valuable in volatile markets like cryptocurrencies, where traditional indicators might generate false signals. Its ability to distinguish between minor price fluctuations and substantive trend shifts can help traders make more informed entry and exit decisions.
When to explore it
The VAMO is most effective during periods of market transition, particularly when a market moves from a low-volatility state to a high-momentum environment. Traders can use it to identify potential breakout moments, especially when the histogram crosses the zero line or shows rapidly expanding bars.
In crypto and other volatile markets, the indicator works best when looking for early trend reversals or significant directional moves. It's particularly useful for traders seeking to capture the initial stages of a trend, whether in scalping, day trading, or swing trading scenarios.
Keep exploring
What we’ve verified
Access, alerts and repainting behaviour have not been independently verified for this indicator. Check the creator’s current publication and settings.
General descriptions and classifications are recovered research. Verified details above identify the specific checks we have completed. Check the creator’s current publication for later changes.