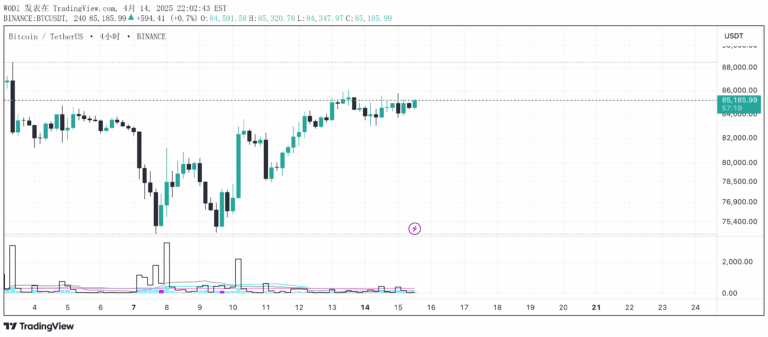
An advanced tool detecting micro-liquidity traps and structural fakeouts by analyzing volume spikes, volatility anomalies, and price structure breaks to identify potential market reversals.
Explore complementary indicator rolesHow it works
The Liquidity Fracture Detector analyzes market dynamics by combining multiple technical indicators to identify potential trap scenarios. It examines volume spikes, comparing current volume to the average, and checks for volatility anomalies by measuring candle ranges against historical volatility.
The script then evaluates price structure breaks, focusing on moments where price briefly breaches a previous high or low but quickly returns within the original range. By detecting extreme wicks and unusual market behavior, the tool highlights potential manipulation points where institutional traders might be hunting stop orders or creating temporary market imbalances.
Why it may be useful
Traders often struggle to identify moments of market manipulation and false breakouts that can trap unsuspecting participants. This detector provides a systematic approach to recognizing these critical market inflection points, helping traders avoid unnecessary losses and potentially capitalize on reversal opportunities.
By combining multiple technical factors, the tool offers a more comprehensive view of market dynamics than traditional single-indicator approaches. It helps traders understand the underlying market structure, revealing potential areas of liquidity manipulation and providing insights into institutional trading behavior.
When to explore it
The Liquidity Fracture Detector is most effective in highly liquid markets with significant institutional participation, such as cryptocurrency, forex, and futures markets. It performs best on intraday timeframes like 1-minute, 5-minute, and 15-minute charts where short-term market dynamics are most pronounced.
Traders should use this tool as a confirmatory indicator alongside other technical analysis methods, not as a standalone trading signal. It is particularly useful when combined with support and resistance zones, order block analysis, and other volume-based trading techniques.
Keep exploring
What we’ve verified
Access, alerts and repainting behaviour have not been independently verified for this indicator. Check the creator’s current publication and settings.
General descriptions and classifications are recovered research. Verified details above identify the specific checks we have completed. Check the creator’s current publication for later changes.