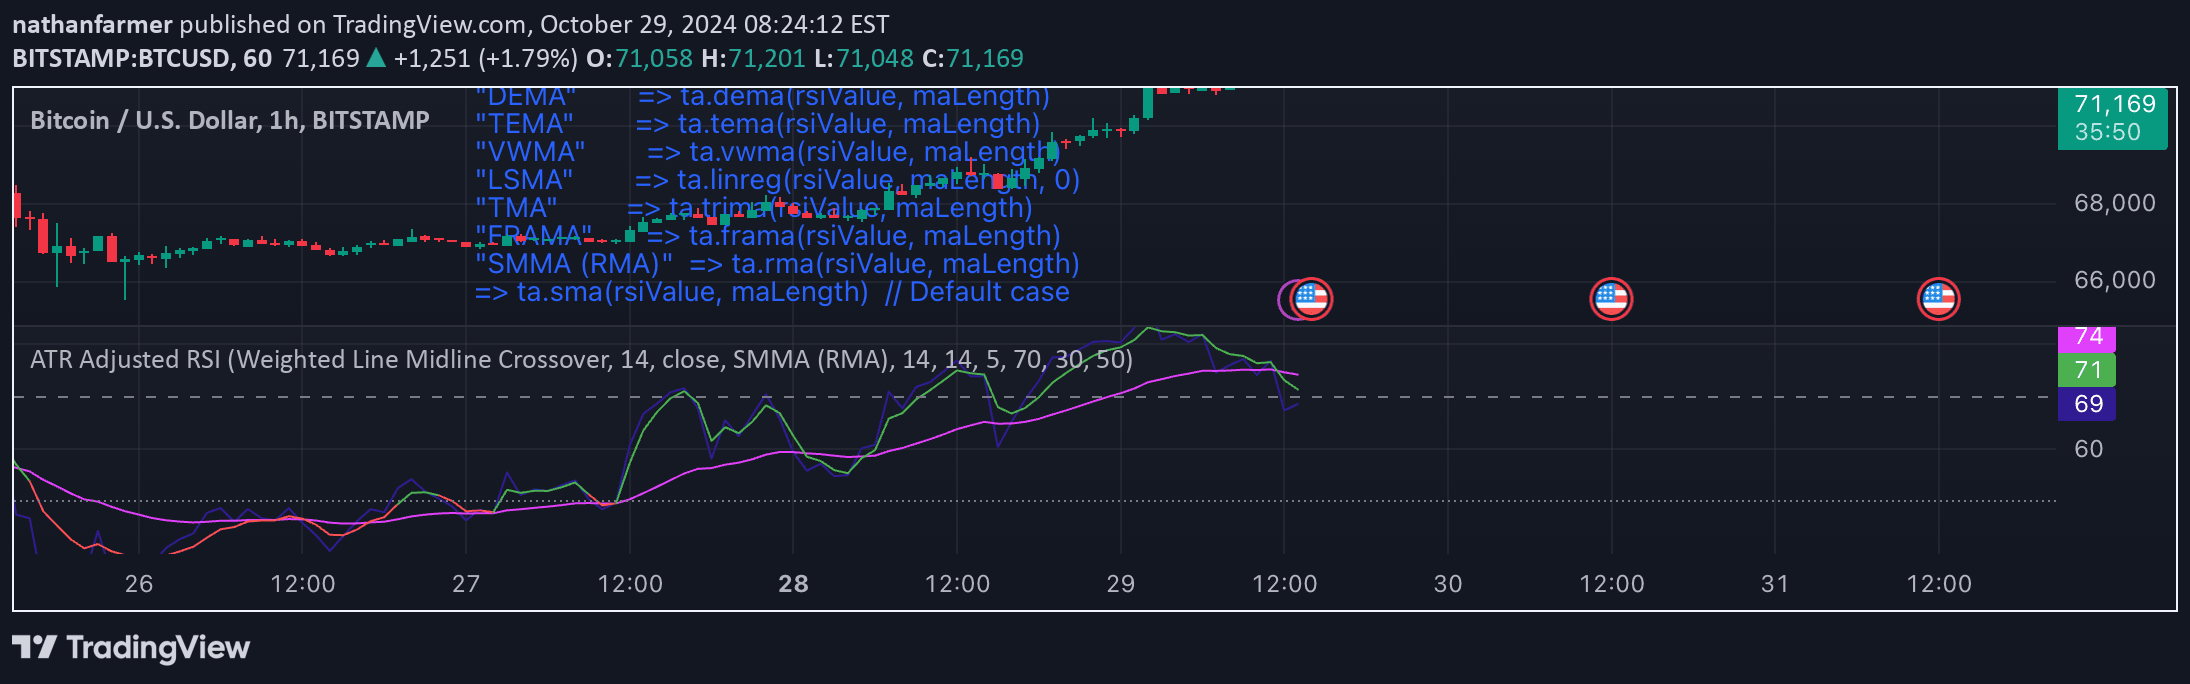
Unbound RSI transforms traditional RSI into a price-aligned momentum indicator using multi-length analysis and dynamic deoscillation technique for enhanced trend and momentum insights.
Explore complementary indicator rolesHow it works
The Unbound RSI calculates three different RSI lengths (short, medium, long) and then deoscillates them by scaling and shifting the values to align with price movements. It uses Average True Range (ATR) to adjust the scaling, making the indicator responsive to market volatility.
Each RSI length is transformed to move alongside the price chart, creating unique momentum lines that can be optionally smoothed using a simple moving average. A dynamic moving average baseline is generated from the medium-length deoscillated RSI, serving as a trend reference point for analyzing market conditions.
Why it may be useful
The Unbound RSI provides traders with a more dynamic and nuanced view of market momentum compared to traditional RSI indicators. By aligning RSI values with price movements and incorporating multiple timeframes, it offers a comprehensive perspective on trend strength and potential shifts in market dynamics.
Its unique approach allows traders to gain insights into momentum across different time horizons simultaneously, enabling more informed decision-making. The volatility-adjusted scaling ensures the indicator remains responsive to changing market conditions, potentially improving signal reliability and trading strategy precision.
When to explore it
The Unbound RSI is most effective in markets with clear trending characteristics, where momentum plays a significant role in price movement. It performs particularly well in assets with moderate to high volatility, where its multi-length and ATR-scaled approach can capture subtle changes in market sentiment.
Traders should utilize this indicator during periods of sustained trends, when comparing momentum across different timeframes, and when seeking a more dynamic alternative to traditional RSI. It is especially valuable when combined with other technical analysis tools to confirm signals and provide a more comprehensive market analysis.
Keep exploring
What we’ve verified
Access, alerts and repainting behaviour have not been independently verified for this indicator. Check the creator’s current publication and settings.
General descriptions and classifications are recovered research. Verified details above identify the specific checks we have completed. Check the creator’s current publication for later changes.