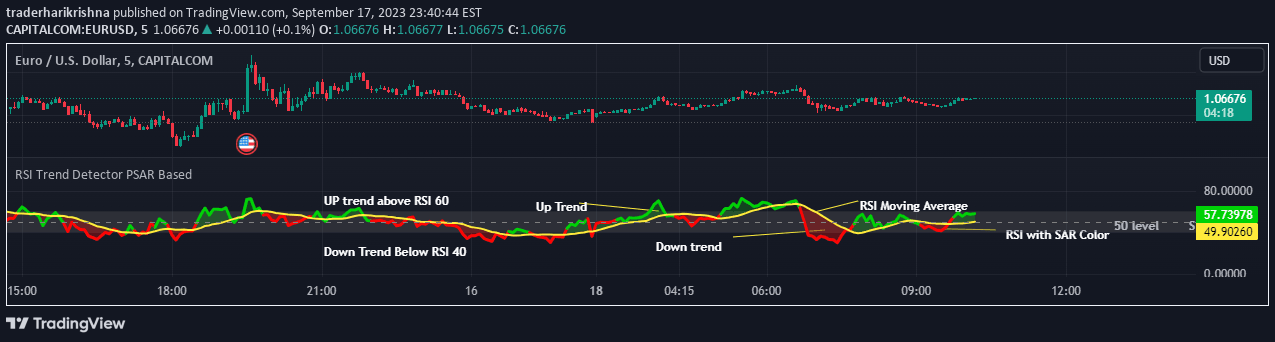
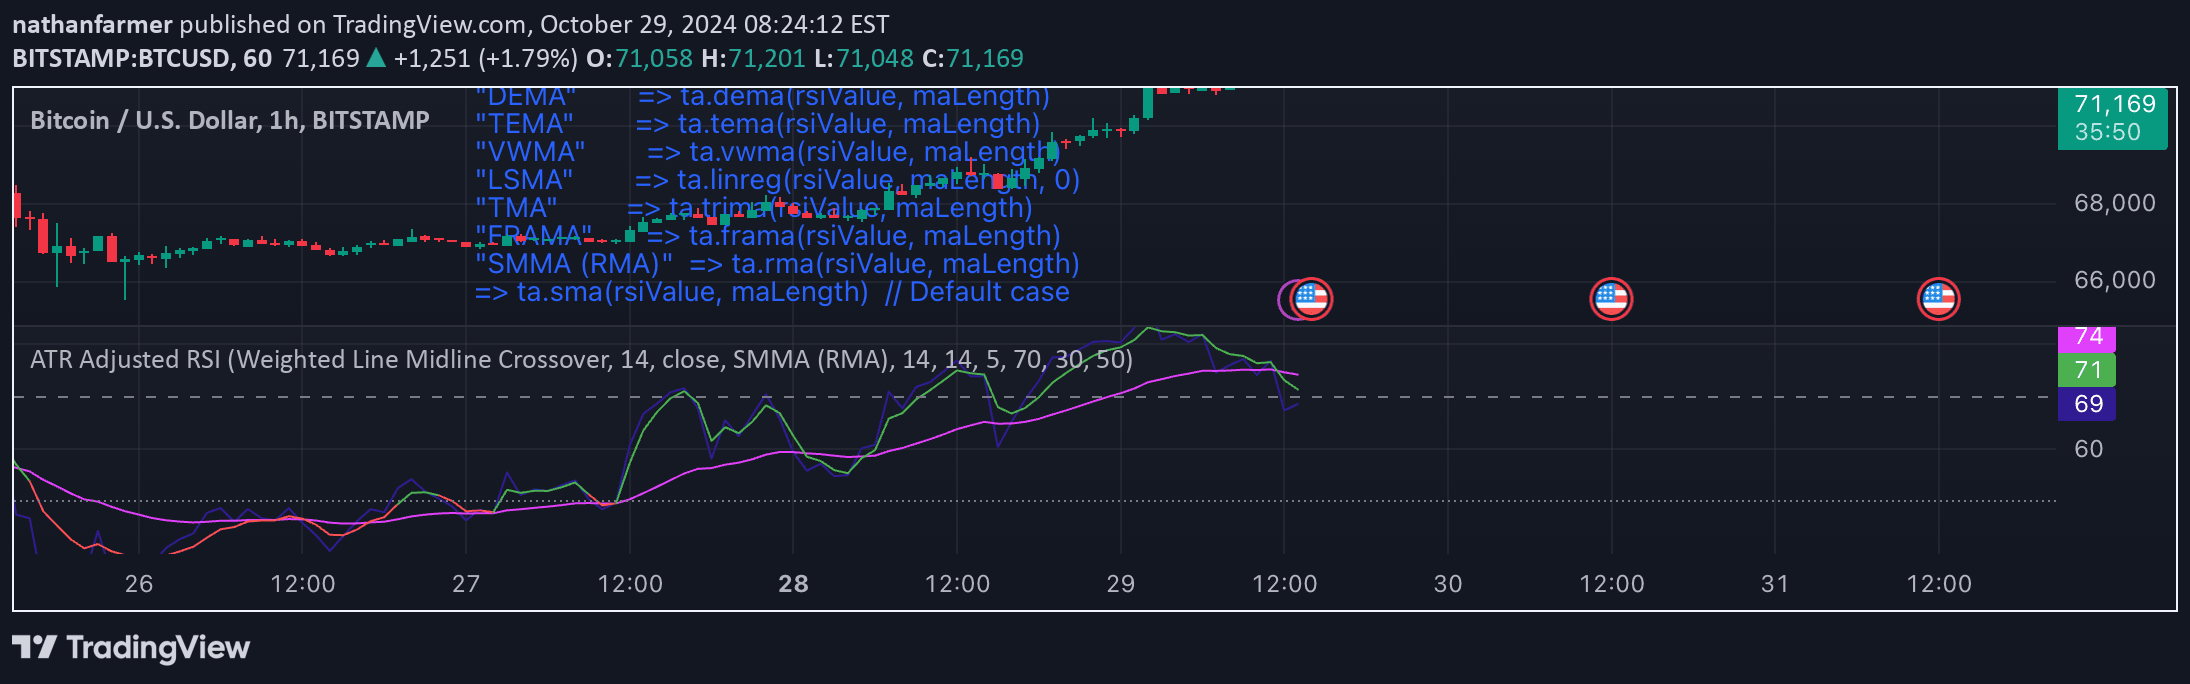
RSI Trail is a technical analysis tool that uses Relative Strength Index and moving averages to dynamically plot support and resistance levels, helping traders identify market trends and potential entry/exit points.
Explore complementary indicator rolesHow it works
The RSI Trail indicator calculates dynamic support and resistance levels by first computing a moving average over 27 periods using typical price. It then defines upper and lower bounds based on customizable RSI levels, adjusting these bounds using Average True Range to account for market volatility.
The indicator creates upper and lower bounds by adding and subtracting volatility-adjusted values from the moving average. Bullish signals occur when price crosses above the upper bound, while bearish signals happen when price falls below the lower bound, providing traders with clear visual cues about potential market movements.
Why it may be useful
The RSI Trail indicator is crucial for traders seeking comprehensive market analysis by combining multiple technical indicators into a single, adaptable tool. It provides nuanced insights into market momentum, volatility, and potential trend reversals, enabling more informed trading decisions.
By integrating different moving average types and dynamically adjusting support and resistance levels, this indicator offers traders a flexible framework for understanding market conditions. Its ability to generate signals and provide visual representations helps traders quickly interpret complex market dynamics and potentially improve their trading strategies.
When to explore it
The RSI Trail indicator is most effective in markets with clear trending characteristics, where price movements show consistent directional momentum. It performs particularly well in volatile markets where traditional support and resistance levels might be less reliable, offering traders a dynamic approach to market analysis.
Traders should consider using this indicator across various timeframes, from short-term scalping to longer-term swing trading. It is especially useful when combined with other technical analysis tools, helping to confirm signals and provide a more comprehensive view of potential market opportunities.
Keep exploring
What we’ve verified
Access, alerts and repainting behaviour have not been independently verified for this indicator. Check the creator’s current publication and settings.
General descriptions and classifications are recovered research. Verified details above identify the specific checks we have completed. Check the creator’s current publication for later changes.