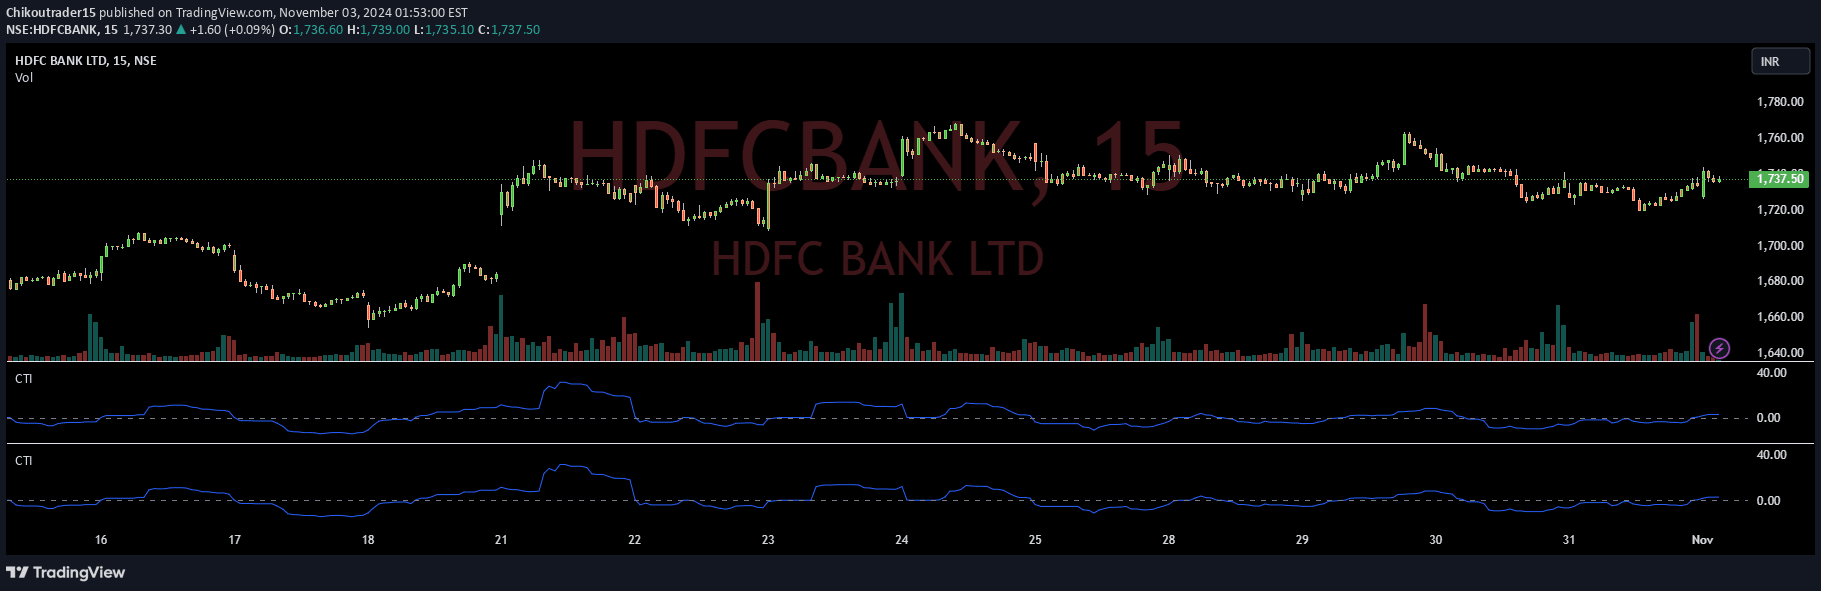
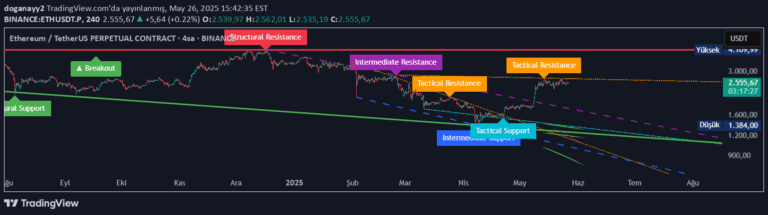
A MACD-based trail indicator that generates dynamic support and resistance lines by combining MACD calculations with Average True Range to track price action and trend changes.
Explore complementary indicator rolesHow it works
The MACD Trail indicator calculates the Moving Average Convergence Divergence (MACD) using custom length settings, creating two dynamic trail lines based on current price and Average True Range (ATR). It generates a bullish trail by subtracting ATR and a bearish trail by adding ATR, dynamically switching between these trails as price action changes.
The indicator starts by rendering the bullish MACD trail and switches to the bearish trail when the current candlestick closes below the existing trail. This adaptive mechanism allows traders to track trend changes and potential support/resistance zones in real-time, providing a flexible and responsive market analysis tool.
Why it may be useful
The MACD Trail indicator offers traders a unique way to visualize market trends and potential trend reversals by combining two powerful analytical concepts: MACD and ATR. By generating dynamic trail lines, it provides a more nuanced view of price action than traditional MACD indicators, helping traders identify potential entry and exit points.
This innovative approach allows traders to quickly understand market momentum and potential trend changes, making it a versatile tool for various trading strategies. The customizable settings enable traders to adapt the indicator to different market conditions and personal trading preferences.
When to explore it
The MACD Trail indicator is most effective in markets with clear trending behavior, where price movements show consistent directional momentum. It works exceptionally well in volatile markets where rapid trend changes are common, providing traders with real-time insights into potential support and resistance levels.
Traders should use this indicator in conjunction with other technical analysis tools to confirm signals and validate potential trade entries and exits. It is particularly useful for identifying trend strength, potential reversals, and dynamic support/resistance zones across different timeframes and trading styles.
Keep exploring
What we’ve verified
Access, alerts and repainting behaviour have not been independently verified for this indicator. Check the creator’s current publication and settings.
General descriptions and classifications are recovered research. Verified details above identify the specific checks we have completed. Check the creator’s current publication for later changes.