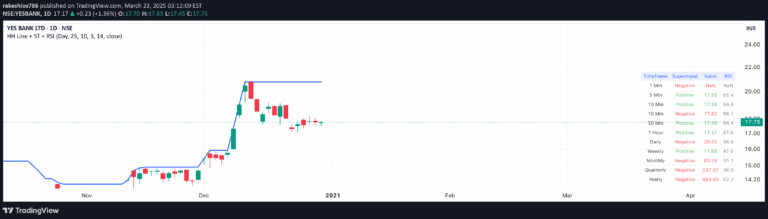
A comprehensive trend strength indicator combining RSI, Supertrend, and EMA Cross to provide dynamic trend detection and visualization with customizable settings.
Explore complementary indicator rolesHow it works
The Trend Strength indicator utilizes three advanced technical analysis methods to determine market direction: RSI, Supertrend, and EMA Cross. It calculates a Total Strength (TS) value between -100 and 100 by combining weighted components from each method, with RSI contributing 50%, Supertrend 20%, and EMA difference 30%.
The algorithm first normalizes each component to a consistent scale, then combines them into a single trend strength metric. This comprehensive approach allows for a more nuanced interpretation of market trends, providing traders with a holistic view of potential price movements and trend reliability.
Why it may be useful
By integrating multiple trend detection algorithms, this indicator offers traders a more robust and reliable method of identifying market direction and momentum. The combined approach helps reduce false signals and provides a more comprehensive view of potential trend changes, which can significantly improve trading decision-making.
The customizable nature of the indicator allows traders to adapt it to different market conditions and personal trading styles. By adjusting settings like detection length, smoothing, and EMA lengths, traders can fine-tune the indicator to match their specific trading strategy and risk tolerance.
When to explore it
The Trend Strength indicator is most effective in markets with clear trending characteristics, such as forex, stocks, and cryptocurrencies. It performs exceptionally well in markets experiencing sustained directional movements, helping traders identify and confirm trend strength and potential reversals.
Traders should utilize this indicator across multiple timeframes, from short-term scalping to longer-term swing trading. Its versatility makes it valuable for both momentum traders seeking to ride strong trends and technical traders looking for precise entry and exit points based on trend changes.
Keep exploring
What we’ve verified
Access, alerts and repainting behaviour have not been independently verified for this indicator. Check the creator’s current publication and settings.
General descriptions and classifications are recovered research. Verified details above identify the specific checks we have completed. Check the creator’s current publication for later changes.