
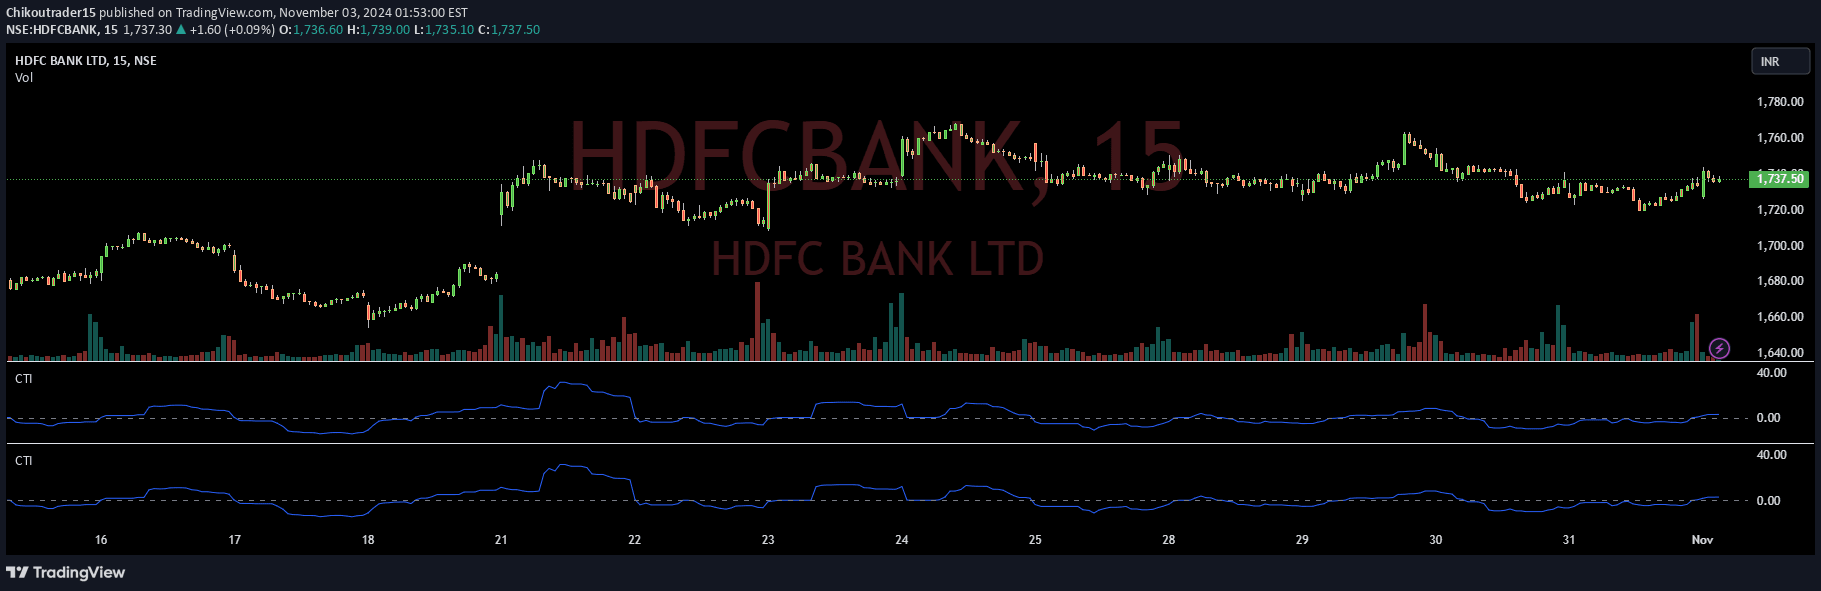
The ChikouTradeIndicator analyzes price range dynamics across different time periods to identify potential trend reversals and market momentum through calculated midpoint differences.
Explore complementary indicator rolesHow it works
The ChikouTradeIndicator calculates market momentum by determining the midpoint between the highest high and lowest low over two distinct time periods: the Turning Length (TL) and the Kumo Length (KL). By comparing these midpoints, the indicator generates a value that oscillates above and below a zero line, providing visual insight into current market dynamics.
When the indicator's value is positive, it suggests bullish momentum, signaling potential buying opportunities. Conversely, negative values indicate bearish momentum, suggesting potential selling opportunities. The dual-length approach allows traders to simultaneously analyze short-term and long-term price trends, offering a nuanced perspective on market movement.
Why it may be useful
The ChikouTradeIndicator provides traders with a sophisticated tool for understanding market momentum and potential trend reversals. By incorporating two distinct time periods, it offers a more comprehensive view of price dynamics than single-period indicators, helping traders make more informed decisions about market direction.
This approach allows traders to identify subtle shifts in market sentiment that might be missed by traditional single-timeframe analysis. The ability to quickly distinguish between bullish and bearish momentum can help traders optimize entry and exit points, potentially improving overall trading strategy and risk management.
When to explore it
The ChikouTradeIndicator is most effective in markets with clear trending characteristics, such as forex, stocks, and futures markets. It performs exceptionally well during periods of sustained price movement, where momentum becomes a critical factor in trading decisions. Traders should consider using this indicator in markets displaying consistent directional trends.
While versatile, the indicator is particularly useful for short to medium-term trading strategies, especially in volatile market conditions. Traders should combine this indicator with other technical analysis tools to confirm signals and reduce the risk of false positives. Its effectiveness increases when used alongside volume indicators and trend confirmation tools.
Keep exploring
What we’ve verified
Access, alerts and repainting behaviour have not been independently verified for this indicator. Check the creator’s current publication and settings.
General descriptions and classifications are recovered research. Verified details above identify the specific checks we have completed. Check the creator’s current publication for later changes.


