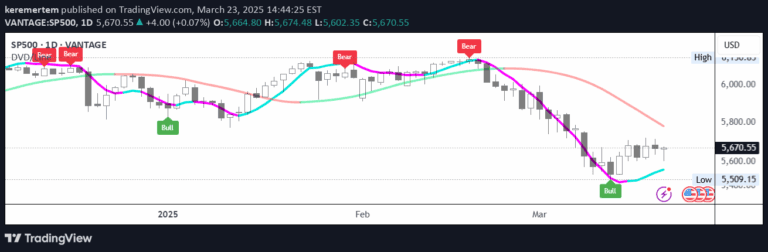
Z-Score SMMA is a dynamic momentum oscillator that normalizes a Smoothed Moving Average using Z-score to detect trend shifts and price deviations across different market conditions.
Explore complementary indicator rolesHow it works
The Z-Score SMMA calculates a Smoothed Moving Average (SMMA) and then normalizes it using Z-score transformation, which measures how far the current price is from its mean in standard deviation units. This process involves computing the average SMMA over a specified lookback period and dividing the difference between the current SMMA and its mean by its standard deviation.
The resulting Z-score provides a standardized metric that allows traders to compare price movements across different market conditions and assets. By setting customizable thresholds, traders can generate long or short signals when the Z-score crosses specific levels, enabling dynamic trend detection and momentum analysis.
Why it may be useful
The Z-Score SMMA offers traders a sophisticated tool for understanding price momentum that adapts to changing market volatility. By normalizing the moving average, it provides a standardized view of price deviation, allowing for more accurate comparisons across different financial instruments and timeframes. This approach helps traders identify meaningful trend shifts and potential reversal points with greater precision.
The indicator's flexibility makes it valuable for multiple trading strategies, from trend following to mean reversion. Its built-in Z-score normalization helps filter out market noise, providing clearer signals about underlying price dynamics and potential trading opportunities across various market conditions.
When to explore it
The Z-Score SMMA is most effective in markets with clear trending or mean-reverting characteristics, such as forex, stocks, and futures markets. Traders can optimize its performance by carefully selecting appropriate lookback periods and Z-score thresholds that match the specific asset's volatility and trading style. It works particularly well in markets with consistent momentum and identifiable trend structures.
Traders should consider using this indicator during periods of moderate to high market volatility, where traditional moving averages might generate less reliable signals. It is especially useful for quantitative traders, systematic traders, and those seeking a data-driven approach to identifying momentum shifts and potential entry or exit points.
Keep exploring
What we’ve verified
Access, alerts and repainting behaviour have not been independently verified for this indicator. Check the creator’s current publication and settings.
General descriptions and classifications are recovered research. Verified details above identify the specific checks we have completed. Check the creator’s current publication for later changes.