Breakout Probability (Expo)
Breakout Probability indicator calculates the likelihood of new market highs or lows by analyzing historical price action and displaying percentage probabilities for potential price levels.
Explore 11,183 indicators. Filter beyond the obvious.
Discover the tools that fit the way you trade.
11,183 tools to explore
Breakout Probability indicator calculates the likelihood of new market highs or lows by analyzing historical price action and displaying percentage probabilities for potential price levels.
The Adaptive Trend Finder is an advanced trading indicator that autonomously detects trend channels using logarithmic scale regression, offering flexibility in long-term or short-term trend analysis.
An advanced trading indicator that detects instantaneously mitigated fair value gaps, providing signals based on rapid price corrections and market imbalances.
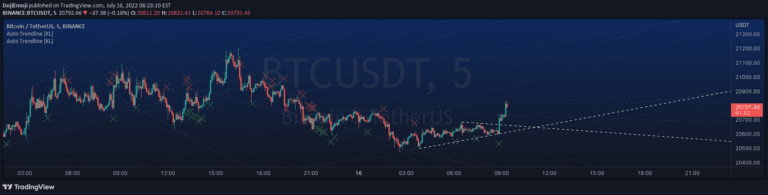
An automated tool that systematically draws trend lines by connecting recent fractals, helping traders identify potential price action patterns without subjective manual drawing.
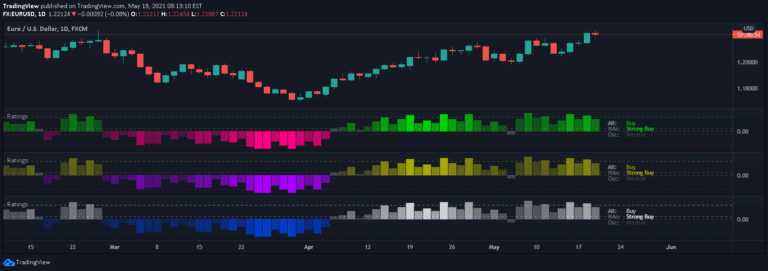
A comprehensive trading signal that aggregates 26 technical indicators into a single rating, evaluating market sentiment through moving averages and oscillators to provide actionable trading insights.
A trading indicator that develops higher timeframe bias by analyzing previous day/week high and low price levels, providing a strategic approach to anticipating potential price movements.
A trading signal that combines trend bias, oscillator analysis, and divergence detection to help traders make more informed decisions about trend continuation, reversal, and potential profit-taking.
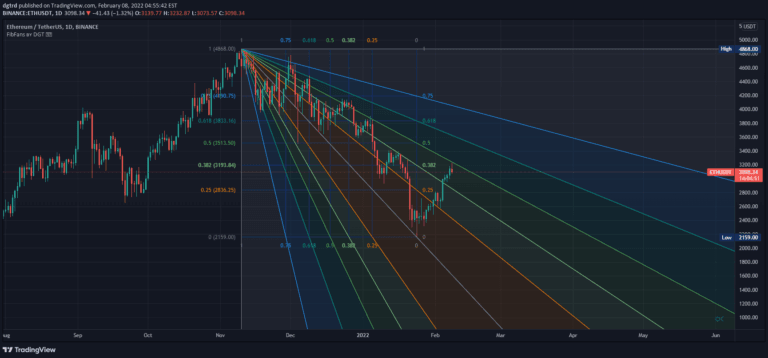
Fibonacci Speed and Resistance Fan is an analytical tool that identifies potential support and resistance levels by drawing lines based on Fibonacci percentages to predict trend changes and market movements.
HyperTrend is a real-time trend estimation indicator that constructs support and resistance channels to help traders identify market direction and potential trading opportunities.
A trend indicator that identifies key market trend levels by calculating highest, lowest, and mid-level values while measuring trend strength through candle positioning.
RSI Trail is a technical analysis tool that uses Relative Strength Index and moving averages to dynamically plot support and resistance levels, helping traders identify market trends and potential entry/exit points.
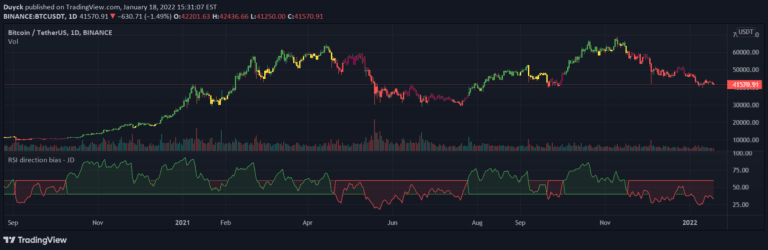
A simple market bias indicator designed to help traders filter potential trades, identify market direction, and discover potential entry points during pullbacks with minimal complexity.
Likes, views, and comments are historical TradingView snapshots. They describe attention, not trading performance.