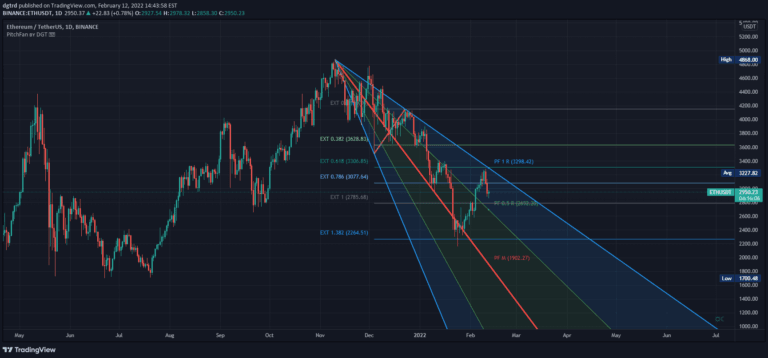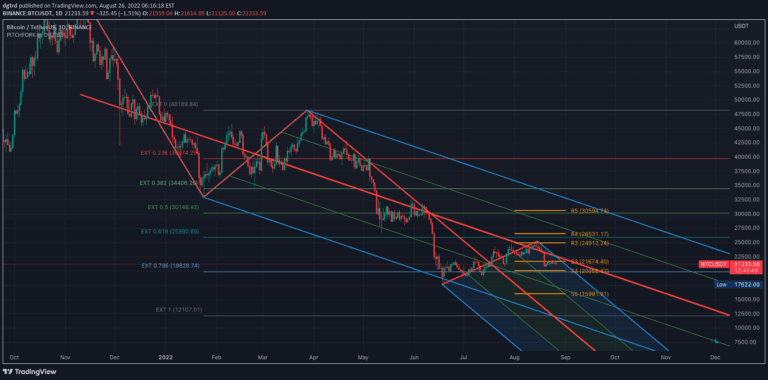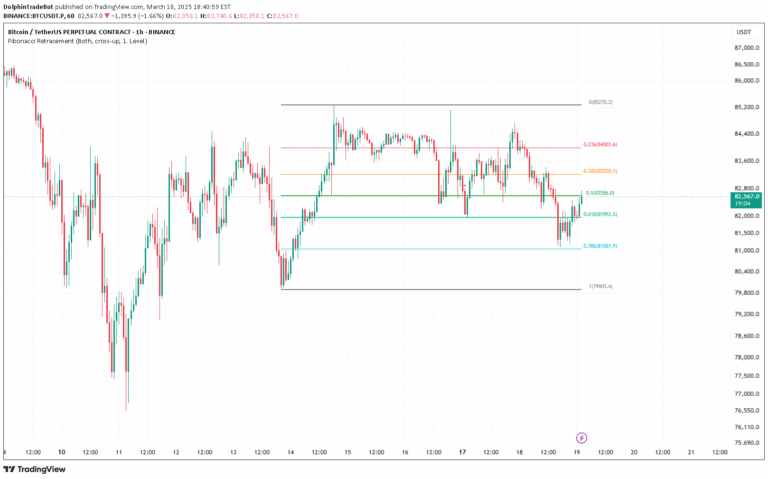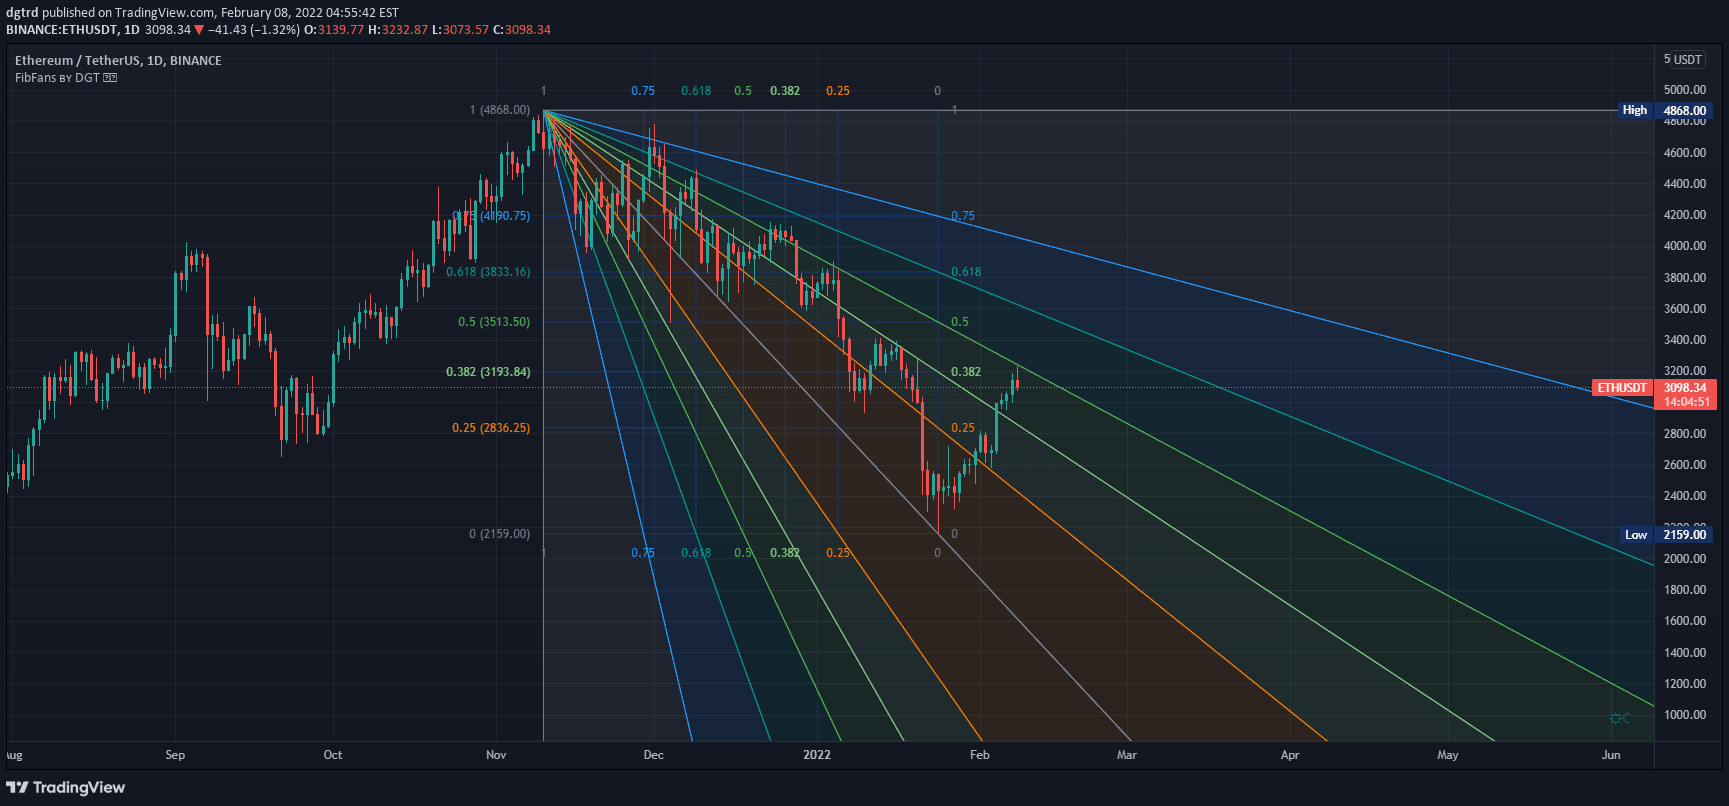
Fibonacci Speed and Resistance Fan is an analytical tool that identifies potential support and resistance levels by drawing lines based on Fibonacci percentages to predict trend changes and market movements.
Explore complementary indicator rolesHow it works
The Fibonacci Speed and Resistance Fan creates a trend line between two extreme points of a chart, either a trough and peak or vice versa. Sequential speed resistance lines are drawn above and below this trend line using Fibonacci percentage levels. These lines help measure trend corrections and the speed of price movement.
The tool uses specific Fibonacci ratios to plot lines that indicate potential support and resistance levels. Traders draw these lines to analyze the trend's potential future trajectory. The lines are typically based on key Fibonacci percentages like 38.2%, 50%, and 61.8%. These lines help visualize potential price movement patterns and trend dynamics
Why it may be useful
The Fibonacci Speed and Resistance Fan provides traders with a systematic approach to identifying potential trend reversals and support/resistance levels. It offers a mathematical framework for understanding price movements based on historical patterns. The tool helps traders make more informed decisions by highlighting potential entry and exit points.
It provides a visual representation of market dynamics that can complement other technical analysis methods. Traders can use these lines to anticipate potential price corrections and trend changes. The tool adds a layer of predictive analysis to trading strategies. It helps traders understand the underlying market structure and potential future price movements
When to explore it
The Fibonacci Speed and Resistance Fan works best in markets with clear trend movements and identifiable high and low points. It is particularly useful in trending markets where price movements show consistent directional bias. Traders should apply this tool when analyzing longer-term price charts with established trends.
It is most effective in markets with moderate volatility where trend patterns are more predictable. The tool is valuable for swing traders and investors looking to identify potential trend reversals. It works well when combined with other technical analysis tools and indicators. Traders should use it as part of a comprehensive trading strategy rather than relying on it exclusively
Keep exploring
What we’ve verified
Access, alerts and repainting behaviour have not been independently verified for this indicator. Check the creator’s current publication and settings.
General descriptions and classifications are recovered research. Verified details above identify the specific checks we have completed. Check the creator’s current publication for later changes.