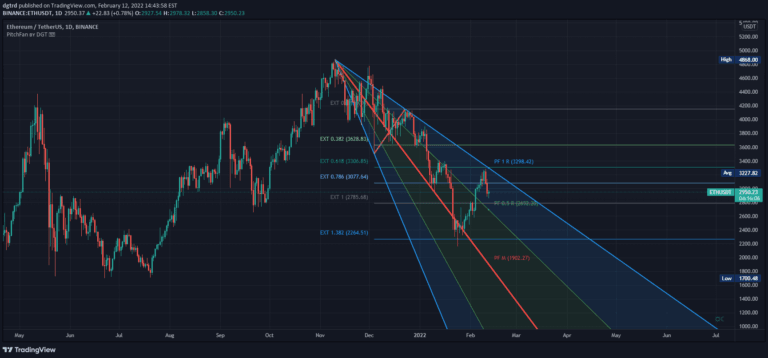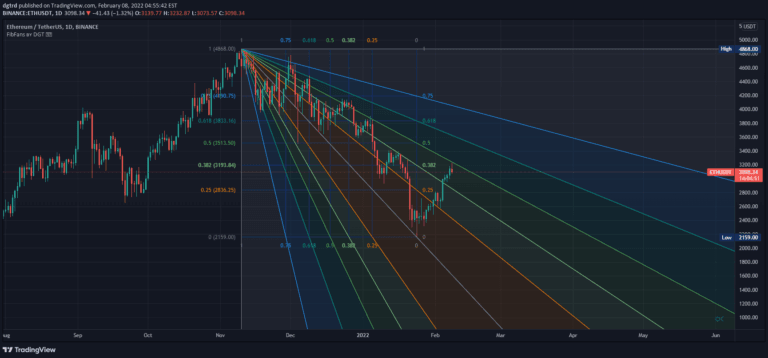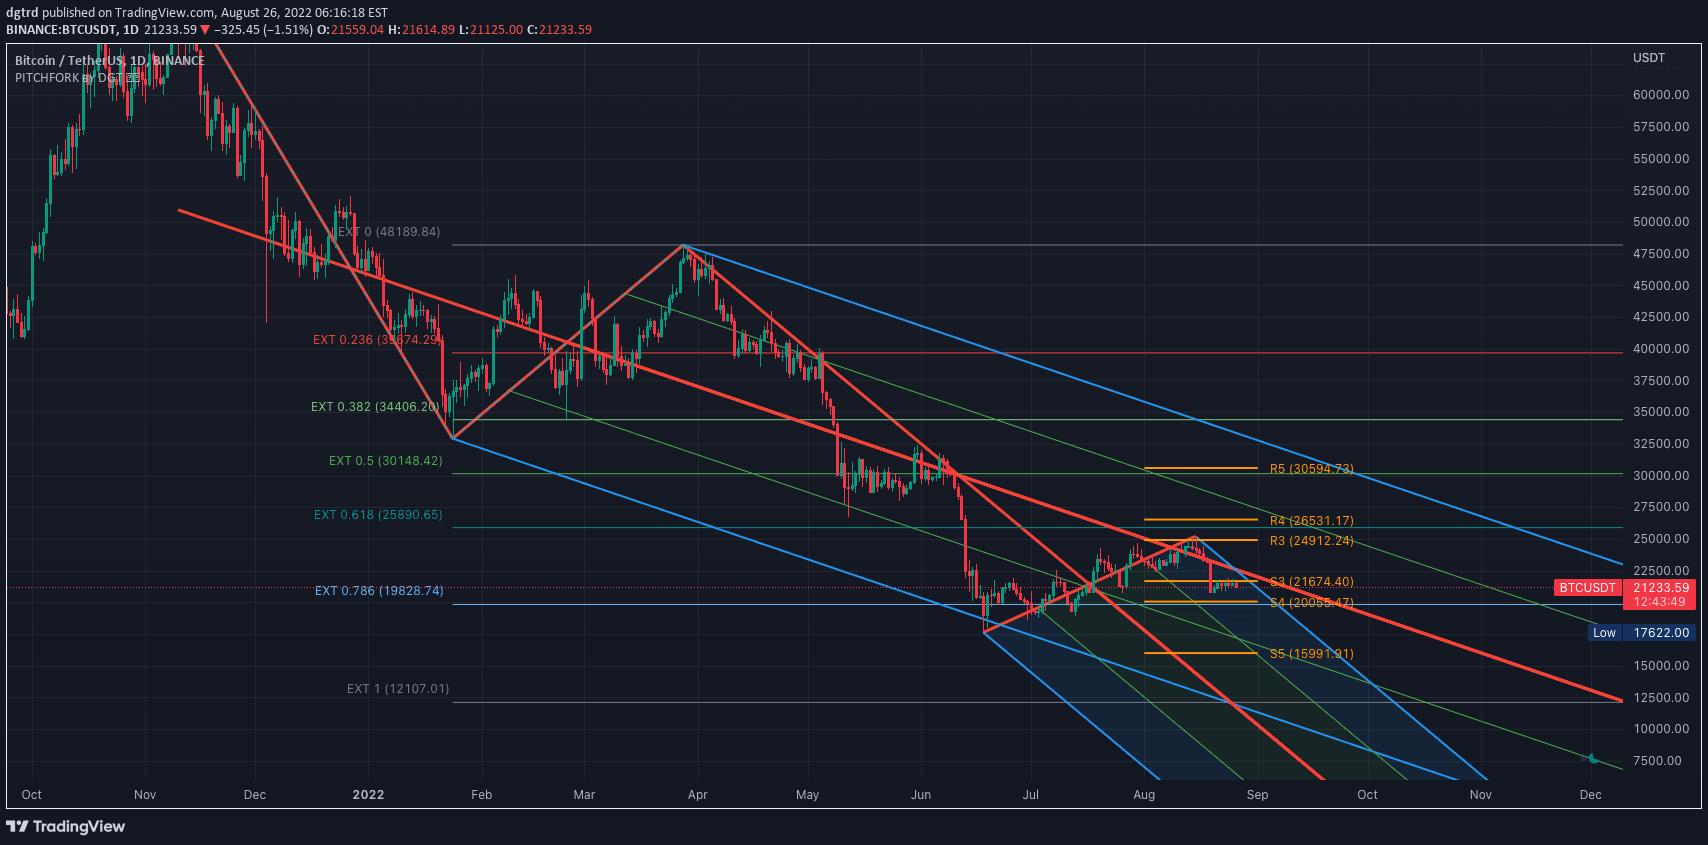
Pitchfork is a technical indicator that helps traders identify potential support and resistance levels by drawing trend lines based on three strategic points in price movement.
Explore complementary indicator rolesHow it works
The Pitchfork indicator, developed by Alan Andrews, creates three parallel trend lines by placing three points at the end of previous market trends. The central line acts as a median channel, with two additional parallel lines forming upper and lower boundaries.
Traders draw these lines by selecting three significant pivot points in the price chart. The method assumes markets move geometrically and cyclically, creating predictable channel patterns. The lines help visualize potential price support and resistance levels, allowing traders to anticipate potential price movements and trend directions
Why it may be useful
The Pitchfork indicator provides traders with a visual tool to understand market geometry and potential price channels. It helps identify key support and resistance levels, which can guide entry and exit decisions. By revealing potential price boundaries, traders can make more informed trading strategies.
The indicator offers insights into market trends and potential price reversals. It can be particularly useful in trending and corrective market conditions. The tool helps traders anticipate potential price movements and manage risk more effectively
When to explore it
The Pitchfork indicator works best in trending markets, with different variations suited to specific market conditions. Andrews' original Pitchfork is most effective in strong trending markets, providing clear directional insights. Schiff and Modified Pitchfork are better suited for corrective or sideways markets.
Traders should use this indicator when seeking to identify potential price channels and trend continuations. It is most reliable when combined with other technical analysis tools and a comprehensive trading strategy. The indicator can help traders set potential entry and exit points
Keep exploring
What we’ve verified
Access, alerts and repainting behaviour have not been independently verified for this indicator. Check the creator’s current publication and settings.
General descriptions and classifications are recovered research. Verified details above identify the specific checks we have completed. Check the creator’s current publication for later changes.