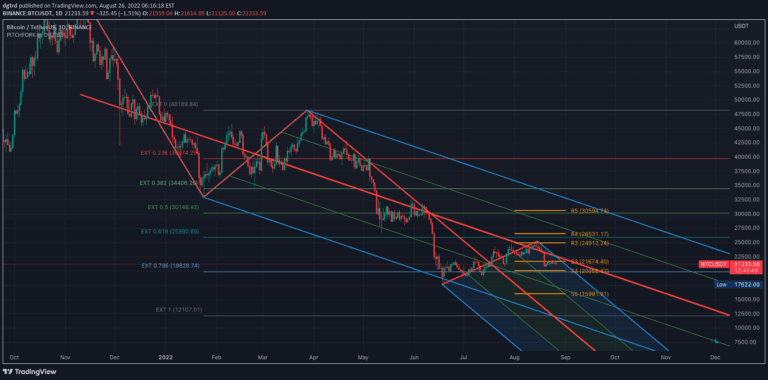
Auto Pitchfork, Fib Retracement and Zig Zag by DGT
Pitchfork is a technical indicator that helps traders identify potential support and resistance levels by drawing trend lines based on three strategic points in price movement.
Explore 11,183 indicators. Filter beyond the obvious.
Discover the tools that fit the way you trade.
11,183 tools to explore
Pitchfork is a technical indicator that helps traders identify potential support and resistance levels by drawing trend lines based on three strategic points in price movement.
FATS is an advanced trading indicator that automatically draws trend lines, Fibonacci levels, and trend sights across multiple timeframes to help traders identify market direction and potential support/resistance zones.
A Pine Script tool for automatically plotting Fibonacci retracement levels, enabling traders to identify potential support and resistance areas within a customizable date range.
AutoFibGauge is an advanced trading indicator that automatically plots Fibonacci retracement levels, confirms trends with moving averages, and provides a visual thermometer for quick market opportunity identification.
Auto Fibonacci Levels indicator automatically identifies key expansion and retracement points, helping traders predict potential price movement and support/resistance zones across different markets and timeframes.
An advanced indicator tracking visible chart bars, displaying Awesome Oscillator values and Elliott Wave peak identification to help traders analyze market dynamics and potential trend movements.
A trading script that highlights previous day's high and low levels, automatically marking breakouts and drawing intraday Fibonacci levels for quick visual reference.
A custom Fibonacci Retracement and Extension indicator that tracks multiple trading sessions, helping traders identify key price levels and potential market movements with precision.
A weekly trading indicator that uses Monday's price range to calculate Fibonacci levels, helping traders identify potential support, resistance, and price movement zones.
An automated Fibonacci retracement tool that plots dynamic support and resistance levels based on a customizable lookback period, helping traders identify potential price reversal zones.
Likes, views, and comments are historical TradingView snapshots. They describe attention, not trading performance.