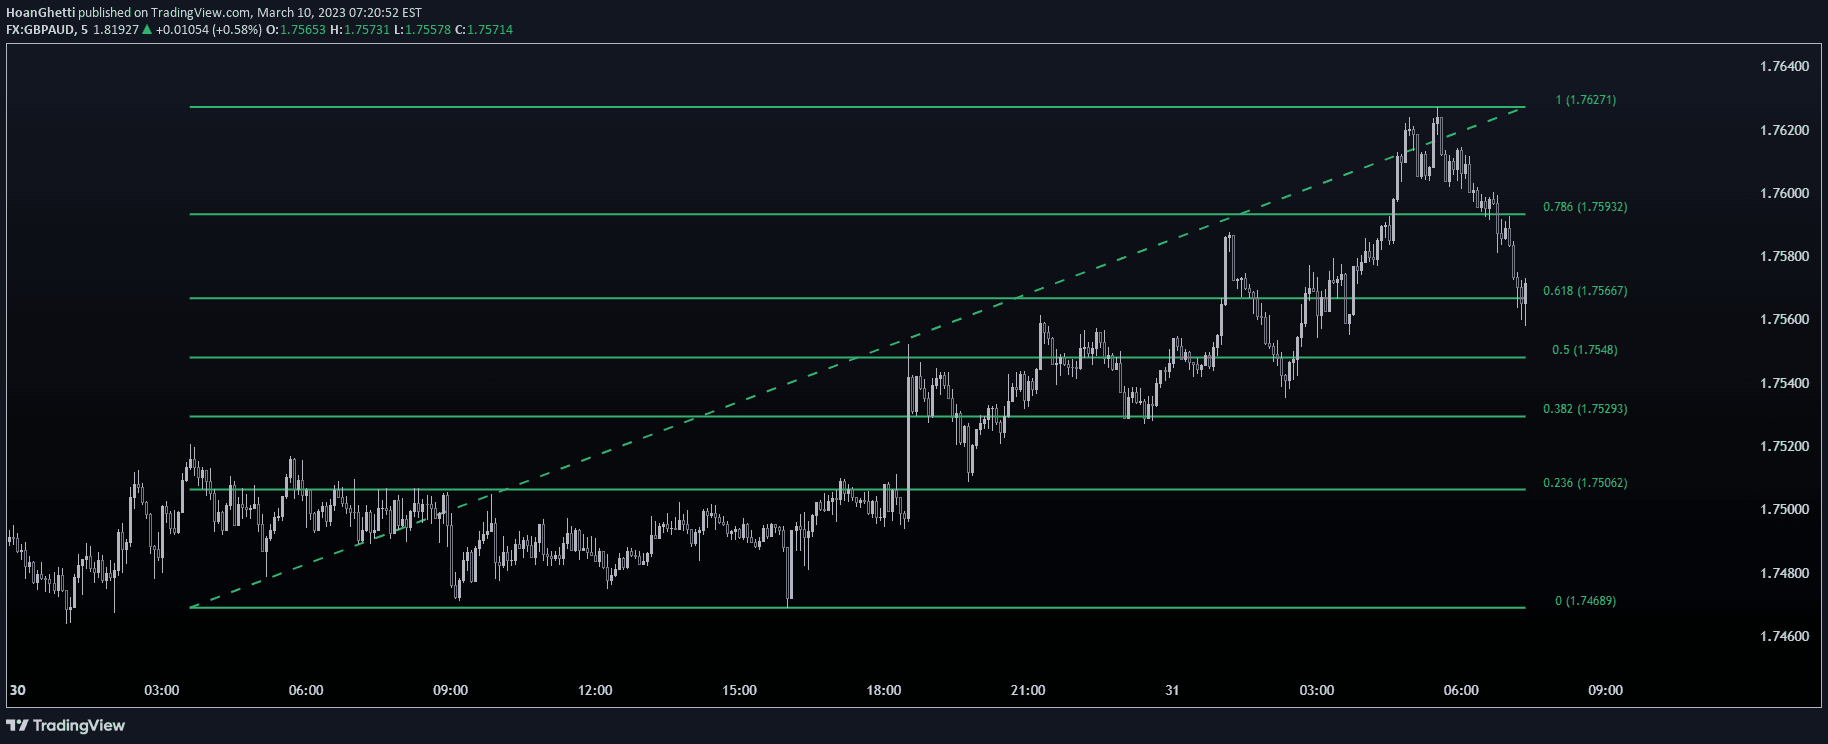
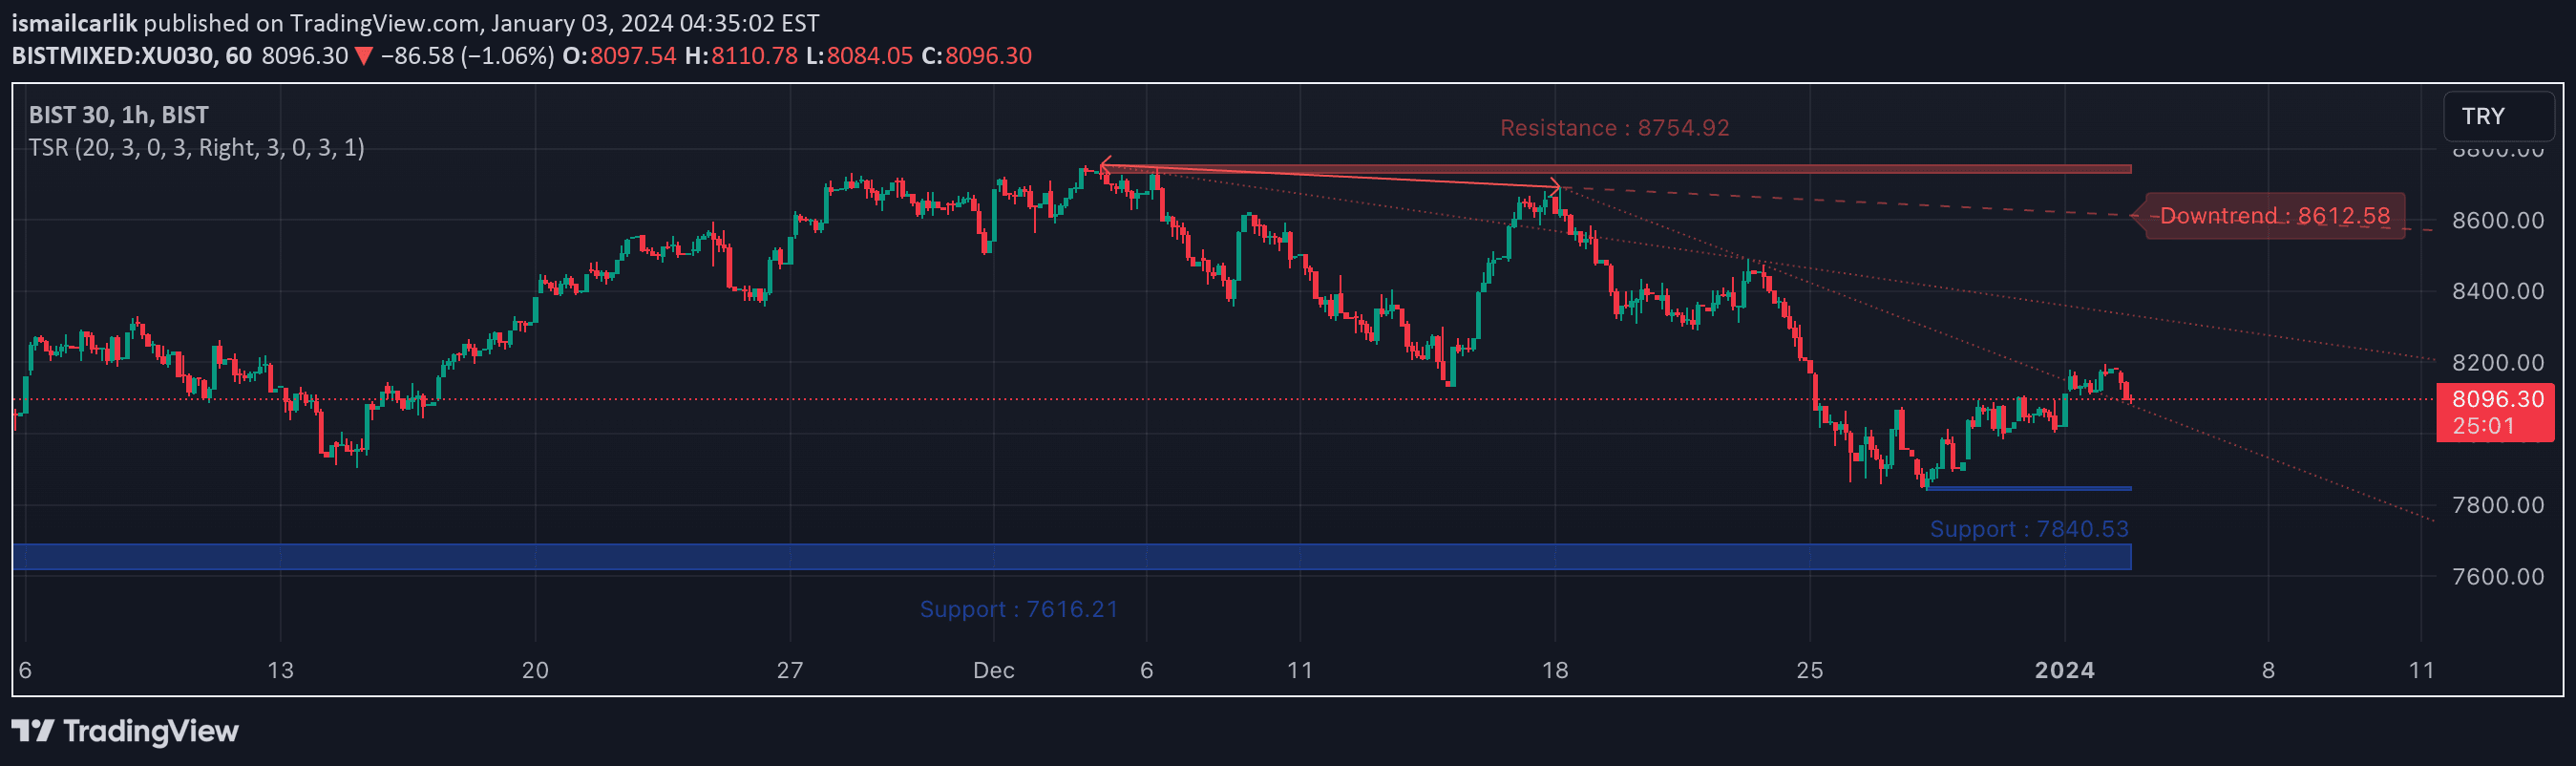
FATS is an advanced trading indicator that automatically draws trend lines, Fibonacci levels, and trend sights across multiple timeframes to help traders identify market direction and potential support/resistance zones.
Explore complementary indicator rolesHow it works
The Fibonacci Auto Trend Scouter (FATS) analyzes price movements across two different timeframes to automatically generate trend lines. It identifies high and low points to create color-coded trend lines that update dynamically with price changes.
The indicator also calculates Fibonacci support and resistance levels based on the highest and lowest values from the shorter timeframe. Additionally, it features trend sights that draw lines from the middle of trend coordinates towards the current price, providing visual guidance on potential market direction
Why it may be useful
FATS provides traders with a comprehensive visual analysis tool that simplifies complex market trend identification. By automatically generating trend lines and Fibonacci levels, it reduces the manual work of technical analysis.
The color-coded trends help traders quickly understand market momentum, while the Fibonacci levels offer potential support and resistance zones. The trend sights provide an additional layer of insight into potential price movement, helping traders make more informed decisions about entry and exit points
When to explore it
FATS is most effective during trending market conditions where clear directional movements are present. It works best for traders who want a multi-timeframe perspective on market trends. The indicator is particularly useful when analyzing markets with consistent price movements, such as forex, stocks, and cryptocurrencies.
Traders can leverage FATS during periods of market consolidation or when seeking to confirm trend reversals. It is especially valuable for swing and day traders who rely on technical analysis for their trading strategies
Keep exploring
What we’ve verified
Access, alerts and repainting behaviour have not been independently verified for this indicator. Check the creator’s current publication and settings.
General descriptions and classifications are recovered research. Verified details above identify the specific checks we have completed. Check the creator’s current publication for later changes.