ICT Killzones + Pivots [TFO]
A customizable trading indicator designed to identify ICT Killzones and track high and low price pivots during specific market sessions with configurable time windows.
Explore 11,183 indicators. Filter beyond the obvious.
Discover the tools that fit the way you trade.
11,183 tools to explore
A customizable trading indicator designed to identify ICT Killzones and track high and low price pivots during specific market sessions with configurable time windows.
A liquidity indicator that highlights swing areas with trading activity, tracking price revisits, accumulated volume, and potential support/resistance zones using customizable filtering.
Hull Moving Average (HMA) is an advanced technical indicator designed to minimize lag and provide smooth trend visualization across multiple variants with customizable settings.
A Linear Regression Channel indicator that tracks price trends, identifies channel breakouts, and analyzes momentum direction using dynamic visual signals and customizable settings.
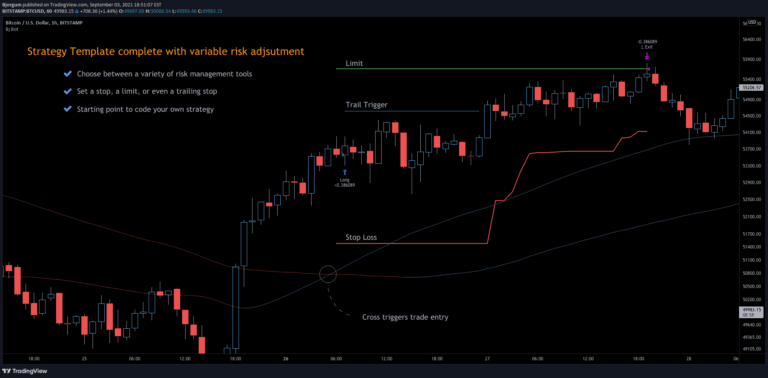
A 3Commas TradingView bot strategy offering automated trading with risk management, using moving average crossovers and customizable stop-loss and limit order settings.
An advanced pattern recognition indicator that identifies ABC chart patterns using trend cloud, ZigZag, and Fibonacci levels to detect potential trading opportunities with customizable settings.
A trading indicator that uses pivot points to identify supply and demand zones, market structure, and potential trading opportunities through visual analysis of price action.
Advanced trading indicator providing comprehensive market structure analysis with customizable sensitivities, identifying price action patterns, order blocks, and session dynamics for strategic trading decisions.
A trading indicator that identifies unique price patterns using Fair Value Gaps and Breaker Blocks, highlighting potential entry and exit points with risk/reward targets.
A multi-timeframe support and resistance indicator that helps traders identify key price levels by analyzing market data across different time frames and customizable settings.
FATS is an advanced trading indicator that automatically draws trend lines, Fibonacci levels, and trend sights across multiple timeframes to help traders identify market direction and potential support/resistance zones.
An advanced trading indicator that detects instantaneously mitigated fair value gaps, providing signals based on rapid price corrections and market imbalances.
Likes, views, and comments are historical TradingView snapshots. They describe attention, not trading performance.