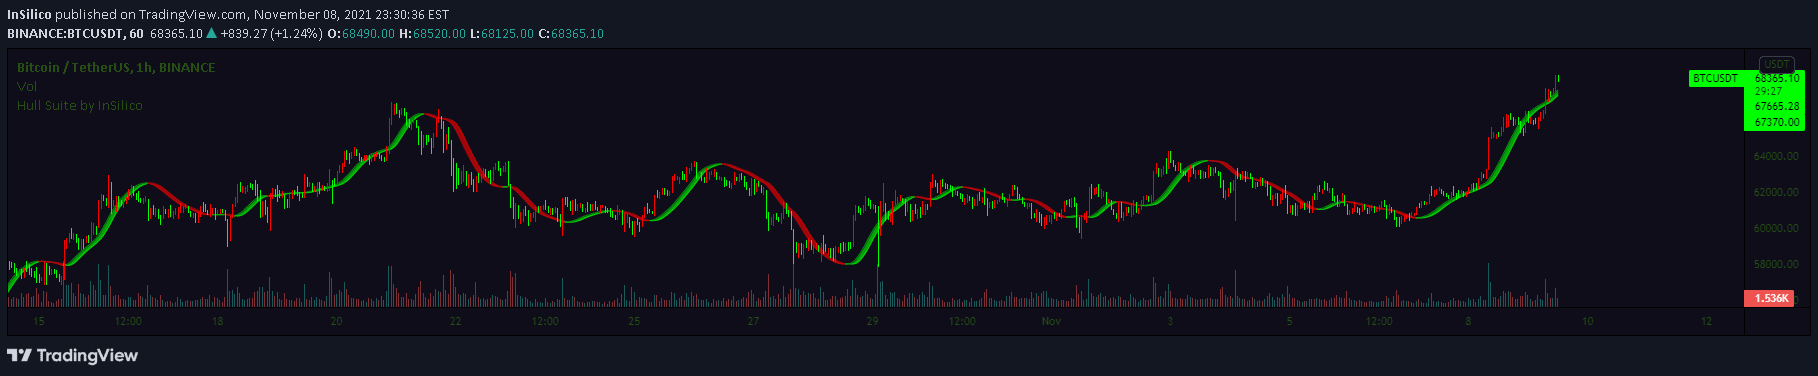
Hull Moving Average (HMA) is an advanced technical indicator designed to minimize lag and provide smooth trend visualization across multiple variants with customizable settings.
Explore complementary indicator rolesHow it works
The Hull Moving Average calculates a moving average using a unique weighted formula that reduces lag and enhances trend responsiveness. It processes price data through multiple computational steps, including square root calculations and weighted averages.
Different variants like HMA, THMA, and EHMA offer varying smoothing techniques. The indicator can be configured to display as a single line or bands, providing traders flexibility in visualization. Its adaptive nature allows for custom parameter adjustments to suit different trading styles and market conditions
Why it may be useful
HMA helps traders identify market trends more accurately by minimizing the delay common in traditional moving averages. Its smooth curve allows for clearer trend recognition and potential trend reversal signals. By reducing noise and lag, traders can make more timely and informed trading decisions.
The indicator's multiple variants provide versatility across different market environments. Its customizable settings enable traders to adapt the tool to specific asset characteristics and personal trading strategies
When to explore it
Hull Moving Average works best in trending markets with clear directional movements. It is particularly effective for identifying medium-term trend changes in stocks, forex, and cryptocurrency markets.
Traders should use HMA when seeking to confirm trend direction and potential entry or exit points. It performs well in markets with moderate volatility, where clear trend signals are crucial. The indicator is most reliable when combined with other technical analysis tools to validate signals
Keep exploring
What we’ve verified
Access, alerts and repainting behaviour have not been independently verified for this indicator. Check the creator’s current publication and settings.
General descriptions and classifications are recovered research. Verified details above identify the specific checks we have completed. Check the creator’s current publication for later changes.