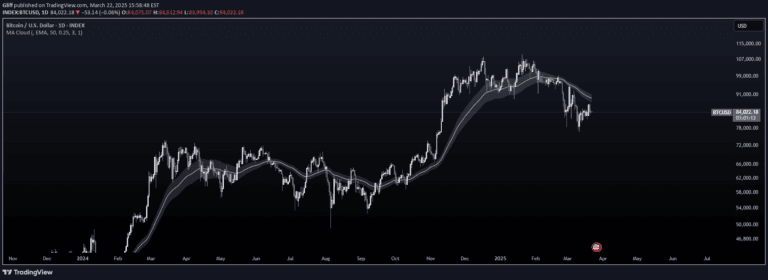
A comprehensive trading signal combining Hull, Exponential, and Simple Moving Averages with Linear Regression to identify trend direction and potential entry points.
Explore complementary indicator rolesHow it works
This trading signal integrates three distinct moving averages: Hull (HMA), Exponential (EMA), and Simple (SMA) with a Linear Regression Indicator to create a comprehensive trend analysis framework. The HMA provides an extremely fast and smooth trend representation, almost eliminating lag, while the EMA gives more weight to recent price data, and the SMA offers a straightforward price average calculation.
The Linear Regression Indicator adds statistical precision by plotting where prices are statistically expected to be, rather than simply averaging past prices. By combining these different moving averages with different lengths, the signal creates a 'cloud' of trend information, with the edges representing each moving average's position and the bar color reflecting the shorter length combined moving averages.
Why it may be useful
This multi-layered approach provides traders with a nuanced view of market trends by leveraging different mathematical calculations and timeframes. The combination of moving averages helps reduce false signals and provides a more robust trend identification mechanism, allowing traders to make more informed decisions based on multiple technical indicators.
By incorporating the Hull Moving Average's low-lag characteristics, the EMA's recent price sensitivity, and the SMA's traditional averaging, traders gain a comprehensive perspective on price movement. The Linear Regression component adds a statistical layer, helping traders understand potential price expectations beyond traditional moving average techniques.
When to explore it
This trading signal is most effective in markets with clear trending behavior, where price movements show consistent directional momentum. It works particularly well in liquid markets with sufficient price data to generate meaningful moving average calculations, such as major stock indices, forex pairs, and prominent cryptocurrency pairs.
Traders should ideally use this signal on timeframes ranging from 15-minute charts for day trading to daily charts for swing trading. It is especially useful during periods of stable market conditions, where trends are more defined and less prone to sudden, unpredictable reversals.
Keep exploring
What we’ve verified
Access, alerts and repainting behaviour have not been independently verified for this indicator. Check the creator’s current publication and settings.
General descriptions and classifications are recovered research. Verified details above identify the specific checks we have completed. Check the creator’s current publication for later changes.