Hull Suite
Hull Moving Average (HMA) is an advanced technical indicator designed to minimize lag and provide smooth trend visualization across multiple variants with customizable settings.
Explore 11,183 indicators. Filter beyond the obvious.
Discover the tools that fit the way you trade.
11,183 tools to explore
Hull Moving Average (HMA) is an advanced technical indicator designed to minimize lag and provide smooth trend visualization across multiple variants with customizable settings.
A comprehensive trading indicator using Hull Moving Averages to detect trend continuations, volatility, and potential entry points across different market conditions.
A sophisticated RSI variant using Kalman filter and Hull moving average to create a more adaptive and responsive momentum indicator that reduces noise and tracks price changes dynamically.
A sophisticated trading indicator combining Fisher Transform and SuperTrend to analyze market trends and potential reversals with customizable settings and advanced algorithmic insights.
A versatile indicator that identifies swing trends and potential market reversals using a modified standard deviation approach on Hull Moving Average with customizable settings.
The Hullinger Bands Indicator combines Hull Moving Averages and Bollinger Bands to provide advanced trend and volatility analysis with dynamic color-coded signals.
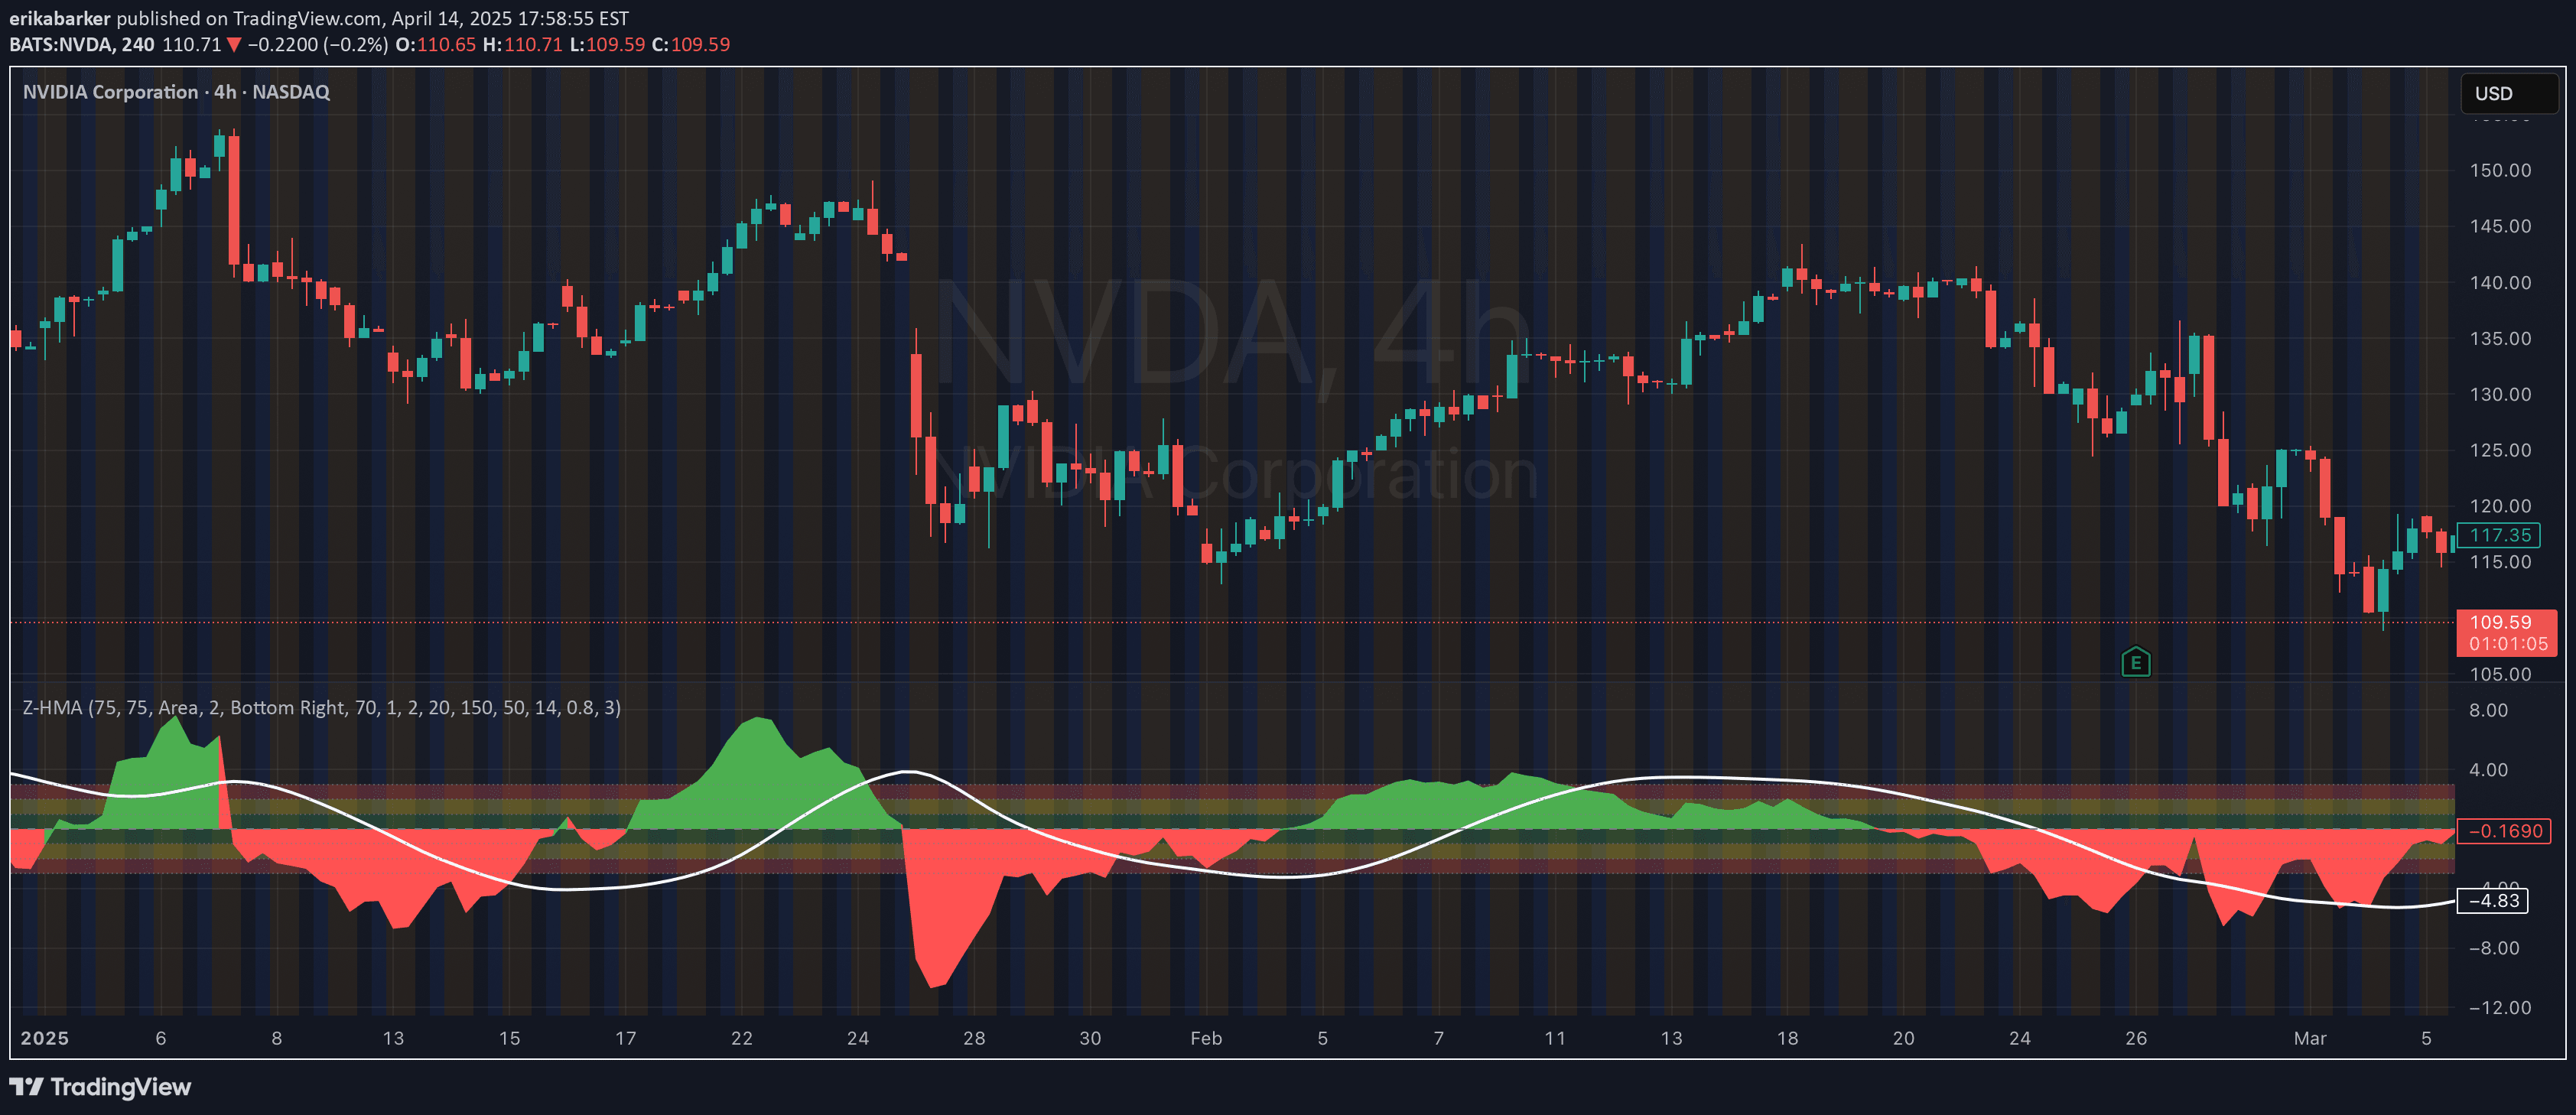
A statistical indicator measuring price movements relative to Hull Moving Average, using Z-Score to quantify price deviation and potential market conditions with color-coded probability zones.
A unique oscillator measuring price pressure by comparing hull averages of close prices against high-low averages, revealing market dynamics and potential trend shifts.
A trend forecasting script using exponential and Hull moving averages to predict market direction through linear regression and dynamic trend analysis.
A multi-timeframe technical analysis tool using Exponential Hull and Hull Moving Averages to generate trading signals and provide market trend insights across different timeframes.
A hybrid oscillator combining MACD with Hull Moving Average, analyzing market direction and volume pressure to provide comprehensive trading insights across different timeframes.
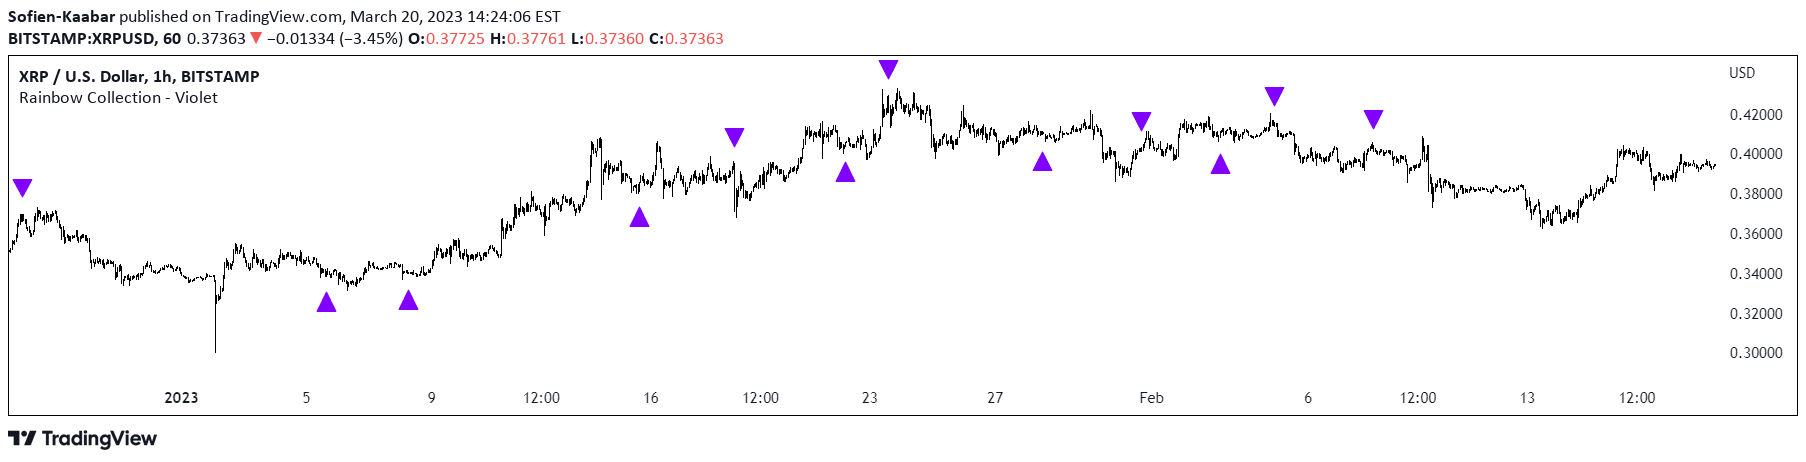
The Violet indicator uses a 20-period Hull moving average to identify potential market trend reversals by analyzing multiple historical price periods relative to their moving averages.
Likes, views, and comments are historical TradingView snapshots. They describe attention, not trading performance.