YOUR INDICATOR RESEARCH STARTS HERE

Find the right indicator.
Understand what it does.

Explore 11,183 indicators. Filter beyond the obvious.
Discover the tools that fit the way you trade.

THE INDICATOR LIBRARY

Explore the possibilities

11,183 tools to explore

9 indicators matching your filters
Save search
LevelsSignal

K's Pivot Points

by Sofien-Kaabar

K's Pivot Points are a technical analysis tool that identifies potential support and resistance levels by calculating pivot points from previous price action over 24-hour periods.

Main price chart · unverifiedScalping · Day Trading
Explore
642likes12.6Kviews5comments
Save
MomentumOscillatorSignal

Rainbow Collection - Blue

by Sofien-Kaabar

A technical analysis indicator that combines market slope and RSI to detect potential price reversals by analyzing the slope's momentum and identifying early trend change signals.

Separate pane · unverifiedScalping · Day Trading
Explore
330likes7.8Kviews2comments
Save
OscillatorSignalTrend

K's Reversal Indicator II

by Sofien-Kaabar

A moving average-based reversal indicator that generates trading signals by tracking market price position relative to a 13-period moving average, identifying potential trend changes.

Separate pane · unverifiedDay Trading · Swing Trading
Explore
311likes7Kviews2comments
Save
PatternsSignal

The Golden Candlestick Pattern

by Sofien-Kaabar

The Golden pattern is a three-candlestick trading configuration based on the golden ratio, identifying potential bullish or bearish trend reversals through specific candlestick relationships.

Main price chart · unverifiedDay Trading · Swing Trading
Explore
289likes7.7Kviews0comments
Save
LevelsTrend

Fibonacci Step Indicator

by Sofien-Kaabar

A Fibonacci-based indicator that calculates moving averages using past highs and lows to create dynamic support and resistance zones for trend analysis.

Main price chart · unverifiedDay Trading · Swing Trading
Explore
208likes5.5Kviews2comments
Save
MomentumOscillatorSignal

RSI Accelerator

by Sofien-Kaabar

RSI Accelerator compares short-term and long-term RSI values to identify potential trend reversals and momentum shifts in asset prices.

Separate pane · unverifiedScalping · Day Trading
Explore
178likes3.3Kviews1comments
Save
TrendSignal

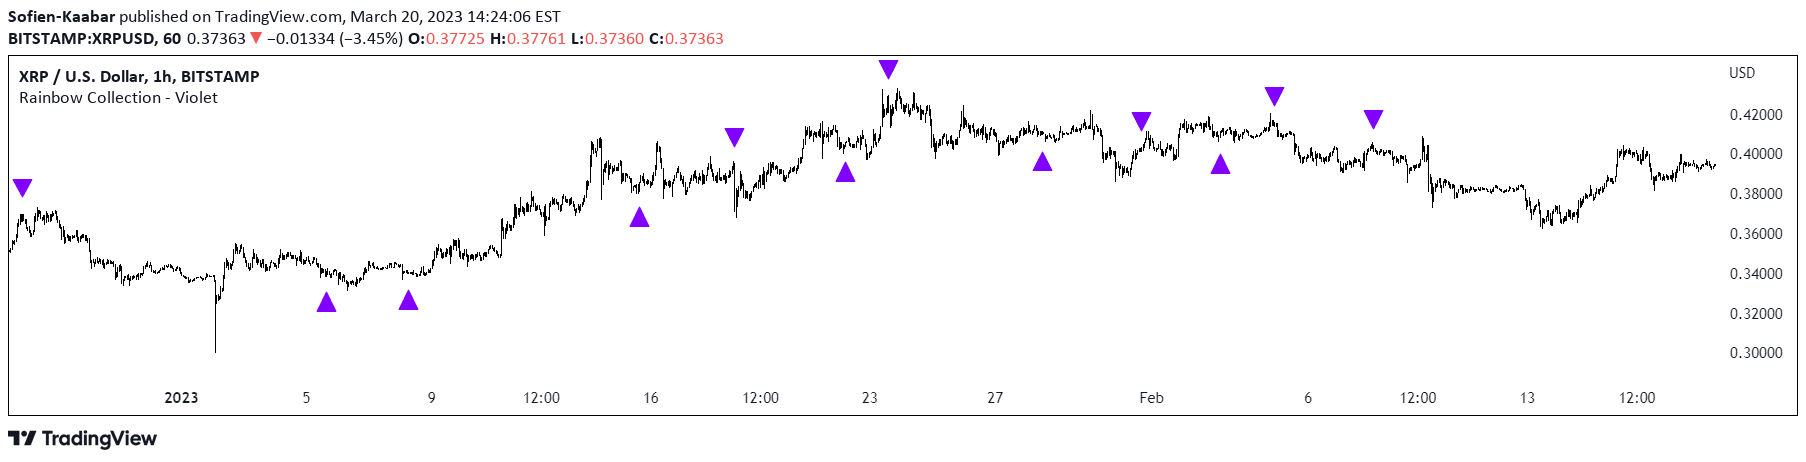
Rainbow Collection - Violet

by Sofien-Kaabar

The Violet indicator uses a 20-period Hull moving average to identify potential market trend reversals by analyzing multiple historical price periods relative to their moving averages.

Main price chart · unverifiedDay Trading · Swing Trading
Explore
124likes4.5Kviews1comments
Save
ChannelsVolatility

Fibonacci Volatility Bands

by Sofien-Kaabar

Fibonacci Volatility Bands are alternative technical analysis bands using Fibonacci sequence moving averages to measure price volatility and potential market movements.

Main price chart · unverifiedScalping · Day Trading
Explore
123likes3.3Kviews0comments
Save

Likes, views, and comments are historical TradingView snapshots. They describe attention, not trading performance.

START WITH A QUESTION

A little less searching.
A lot more understanding.

Tell DeepAlpha what you need. Get an explanation, a shortlist,
and a direct path to the indicators behind it.

Ask DeepAlpha